Educational research only, not financial advice. Sources were checked on 17 October 2026.
1. Introduction
1.1 The basics, in plain English
This section explains every term the paper relies on. Readers who trade can skip to 1.2.
| Day trading | Buying and selling within the same day, closing every position before the market shuts. Profits come from moves over minutes or hours. |
|---|---|
| Long and short | Going long means buying, to profit if the price rises. Going short means selling first (borrowed shares) and buying back later, to profit if the price falls. Day traders do both. |
| ETF | An exchange-traded fund: a basket of shares traded like a single share [2]. SPY tracks the S&P 500, QQQ the Nasdaq-100, IWM the Russell 2000 and DIA the Dow Jones Industrial Average [3]. |
| Candlestick | One bar on a price chart covering a fixed time, here 1, 5 or 15 minutes. It shows four prices: the open and close (the thick body), and the high and low (the thin wicks). Green closed higher than it opened, red lower [43]. |
| Chart reading | Any rule that turns a chart into "buy" or "sell". Here, either a candlestick pattern (a recognised shape made by one to three candles) or an indicator (a formula applied to past prices, such as an average or an oscillator). |
| Basis point (bp) | One hundredth of one percent: 1 bp = 0.01% [1]. On a £1,000 trade, 1 bp is 10p. |
| Spread and costs | The best price to buy (the ask) is a little above the best price to sell (the bid); the gap is the spread [5]. With exchange fees and broker charges, it is a cost paid on every trade. |
| Hit rate | The share of trades that moved the way the reading said. A coin gets 50%. |
| Coin-flip trader | A simulated trader who trades at exactly the same moments as a reading, holds for exactly as long, but picks long or short by flipping a coin. If a reading can't beat that, it knows nothing about direction. |
| p-value | Roughly how often a result at least this good would appear by chance if the reading had no edge. Below 0.05 is a common, imperfect threshold for "significant"; it is not the probability that the reading works [8]. |
| Multiple testing | Testing 30 strategies means a few will look good by luck. Corrections (Holm, Bonferroni) raise the bar to account for that [33][34]. |
1.2 The question: is it worth the hours?
Learning to day trade by reading charts is sold as a skill: study the patterns, practise, and in time you'll see what others miss. For a retail trader, that is only worth hundreds or thousands of hours if the skill produces an edge, a reliable advantage that survives costs. Otherwise the time buys nothing, and the trading itself costs money.
This paper asks the most direct version of that question. Take the chart readings that most people actually learn, define them exactly as they are taught, and test them on the instruments day traders trade most. Do they predict the next move better than a coin, by enough to pay for trading?
1.3 Who you are trading against
Retail traders are not the majority of the market. Retail trading can't be observed directly, so estimates vary with method: analysts at Jefferies put retail at 20.1% of US equity volume in the third quarter of 2025, the second-highest share on record [9], while exchange operator MEMX estimates 30–37% depending on conditions [10]. The rest is institutions, professional market makers and algorithmic firms. Much US retail order flow doesn't even reach an exchange: it is executed off-exchange by wholesale market makers [10], who may pay brokers for it, known as payment for order flow [11]. When a retail order is filled that way, the other side is a professional firm whose business is pricing it.
That doesn't make an edge impossible, but it sets the bar. A chart pattern visible to anyone with a free charting app is also visible to firms that can test it on far more data, and act on it faster and more cheaply, than an individual can.
1.4 What happened to real day traders
Three large studies looked at what actual traders earned, using brokerage or exchange records rather than self-reported results:
- US households, 1991–1996. Among 66,465 households at a large discount broker, those that traded most earned 11.4% a year, against 17.9% for the market. Their trading before costs was not worse; the costs of trading so much were the difference [14].
- Taiwan, 1992–2006. Using every trade on the Taiwan Stock Exchange, Barber, Lee, Liu and Odean found that fewer than 1% of day traders could predictably and reliably earn positive returns net of fees [12].
- Brazil, 2013–2015. Among individuals who started day trading equity index futures and persisted for more than 300 days, 97% lost money. Very few earned more than a bank teller's wage, and the authors found no evidence that traders improved with experience [13].
Regulators see the same thing in leveraged short-term trading. When the European Securities and Markets Authority restricted contracts for difference (CFDs) in 2018, national regulators' analyses showed that 74–89% of retail CFD accounts typically lost money [15]. UK providers must now publish the share of their retail accounts that lose money [16].
None of these studies isolates chart reading specifically; people trade for many reasons. That gap is what this paper fills: whatever traders actually do, do the most popular readings themselves contain an edge?
1.5 Reading the candles: where it comes from and what tests found
Candlestick charts are popularly said to have been invented by the 18th-century Japanese rice trader Munehisa Homma. They were introduced to Western traders by Steve Nison's 1991 book Japanese Candlestick Charting Techniques [17][43], although Nison later wrote that it is unlikely Homma used candle charts at all [43]. Pattern books now catalogue over a hundred named patterns [42]. When candlestick strategies were tested on large US stocks, they were not generally profitable [18].
Indicators have a more mixed record. Simple moving-average rules appeared profitable on nearly a century of daily Dow Jones data [19]. Sullivan, Timmermann and White then showed how to correct for the many rules that had been tried: the best rule's advantage survived that correction over the original period, but did not carry over to the decade that followed [20][21]. A survey of the field found many studies reporting profits but warned about exactly these problems: data snooping, choosing rules after the fact, and underestimated costs [22]. Chart patterns drawn by eye, such as head-and-shoulders, are harder still to test, because there is no single agreed definition; Lo, Mamaysky and Wang had to build one statistically to study them [23].
Most of this research uses daily data. Day trading lives on 1- to 15-minute candles, and that is where this paper looks.
1.6 Which ten, and why
"The most popular" needs a measure anyone can check. Google Trends, the usual choice, refused automated requests during this study, so popularity is measured by English Wikipedia page views from 1 October 2025 to 30 September 2026. These come from the Wikimedia Foundation's public pageviews service, counting human readers on all devices [24]. Page views measure how many people look something up, which is a reasonable proxy for how widely it is learned.
Candidates were every reading covered by the standard references (Nison's candlestick book [17], Bulkowski's pattern encyclopedia [42], and the originators of the main indicators [26]–[31]) that has its own Wikipedia article. To be tested, a reading must give a mechanical buy or sell signal, so that anyone applying it gets the same answer. Four kinds were excluded on that basis:
Table 1. Excluded readings and why. Views over the 12 months.
| Excluded | Views | Reason |
|---|---|---|
| Candlestick chart | 75,426 | A type of chart, not a reading |
| Fibonacci retracement | 38,475 | Needs a subjective choice of which high and low to measure from |
| Average true range | 22,685 | Measures volatility; gives no direction |
| Head and shoulders, support and resistance, cup and handle, double top/bottom | 14,112–18,926 | Drawn by eye; no single agreed mechanical definition [23] |
Most individual candlestick patterns (hammer, engulfing, shooting star and so on) have no article of their own: they redirect to Wikipedia's single "Candlestick pattern" page [25]. So candles enter as one reading, the classic reversal patterns combined, ranked by that page's views. The ten that remain:
Table 2. The 10 most popular mechanical chart readings, by English Wikipedia page views, 1 October 2025 – 30 September 2026.
| # | Reading | Wikipedia article | Views |
|---|---|---|---|
| 1 | Moving average | Moving average | 164,585 |
| 2 | RSI | Relative strength index | 71,079 |
| 3 | MACD | MACD | 50,800 |
| 4 | Candlestick patterns | Candlestick pattern | 42,970 |
| 5 | Bollinger Bands | Bollinger Bands | 38,666 |
| 6 | VWAP | Volume-weighted average price | 37,884 |
| 7 | Stochastic oscillator | Stochastic oscillator | 14,517 |
| 8 | ADX / DMI | Average directional movement index | 14,034 |
| 9 | Ichimoku | Ichimoku Kinkō Hyō | 13,857 |
| 10 | Donchian channel | Donchian channel | 10,684 |
Next in line, not tested, were pivot points (10,138), Parabolic SAR (9,905) and the doji candle (9,178). The full design, including this ranking, the rules, the tests and the criteria for "works", was written down and approved on 17 October 2026 before any code was run, and the page-view data is saved as a fixed, checksummed snapshot (Appendix A).
2. Data
| Prices | Massive (formerly Polygon.io) 1-minute bars [37], the same pinned data as RP-001 and RP-002 [38][39] |
|---|---|
| Instruments | SPY, QQQ, IWM, DIA [3] |
| Period | 21 October 2024 to 14 October 2026: 492 regular trading days per ETF, 09:30–16:00 New York [4] |
| Candles | 1-, 5- and 15-minute candles built from the same 1-minute data (390, 78 and 26 per day). A minute without trades takes the previous price. Checked against a standard resampling of the raw data, every 5-minute candle is identical for SPY, QQQ and IWM; for DIA, 0.15% differ slightly because of such untraded minutes [39]. Indicators run continuously across days. |
| Popularity | Wikimedia pageviews, 29 candidate articles, 12 months [24], saved as a pinned snapshot |
3. Methodology
3.1 The ten readings, as rules
Each reading uses its standard settings. A signal is decided when a candle closes, using only that candle and earlier ones.
Table 3. The rules tested. "Buy" means go long; "sell" means go short.
| Reading | Buy signal | Sell signal |
|---|---|---|
| Moving average | 20-candle average crosses above the 50-candle average | Crosses below |
| RSI (14) [26] | RSI rises back above 30 (leaving "oversold") | Falls back below 70 (leaving "overbought") |
| MACD (12, 26, 9) [27] | MACD line crosses above its signal line | Crosses below |
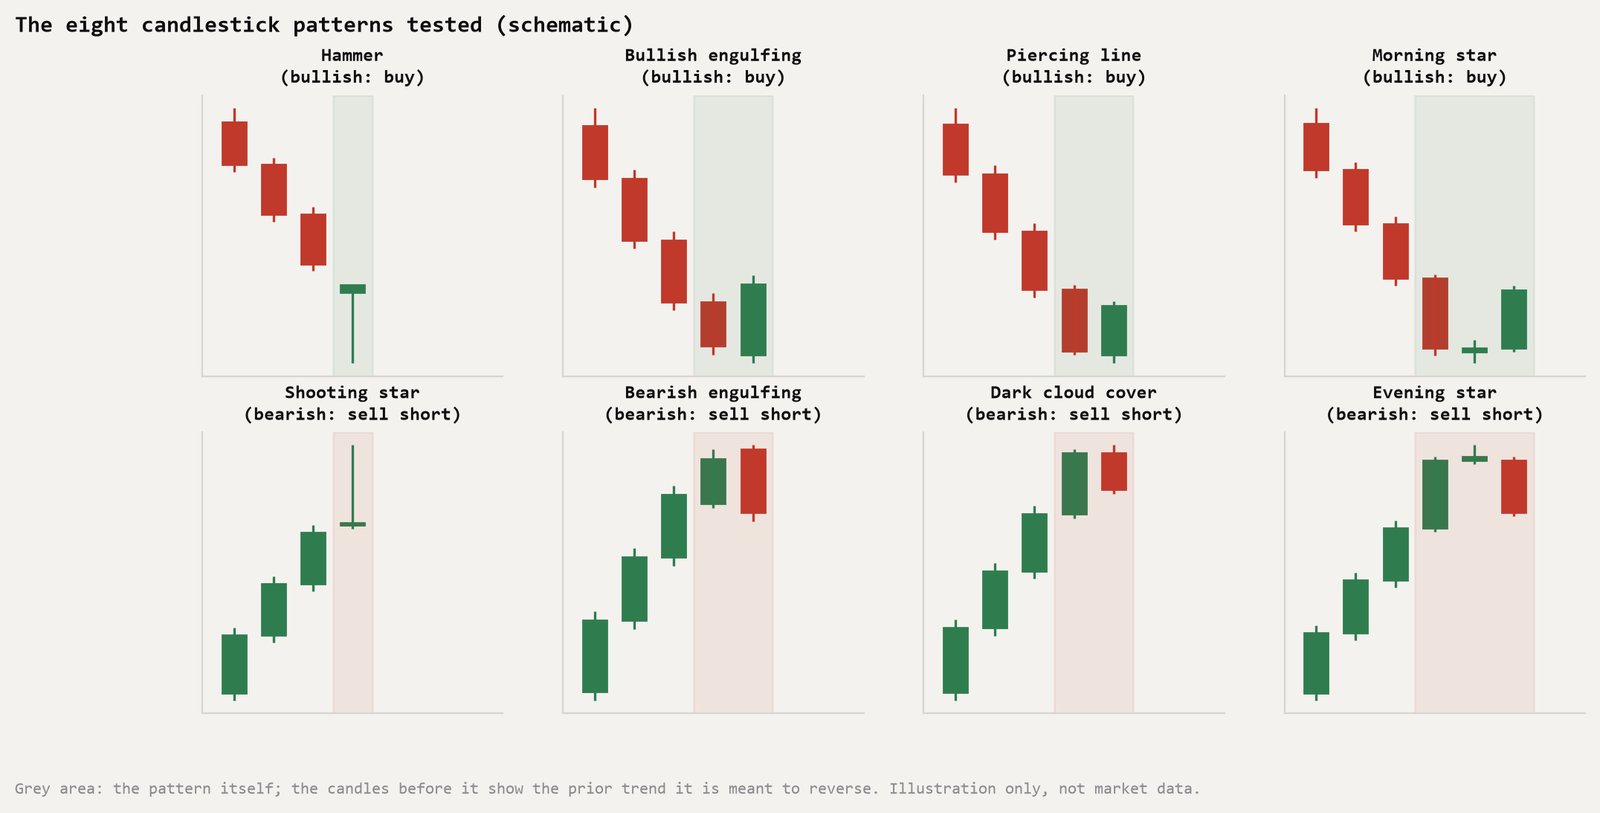
| Candlestick patterns [17] | Hammer, bullish engulfing, piercing line or morning star, after a 3-candle decline | Shooting star, bearish engulfing, dark cloud cover or evening star, after a 3-candle rise |
| Bollinger Bands (20, 2) [28] | Close moves back above the lower band | Moves back below the upper band |
| VWAP [32] | Close crosses above the session's VWAP (from each minute's typical price and volume) | Crosses below |
| Stochastic (14, 3) [29] | %K crosses above %D while below 20 | Crosses below %D while above 80 |
| ADX / DMI (14) [26] | +DI crosses above −DI while ADX > 25 (a strong trend) | −DI crosses above +DI while ADX > 25 |
| Ichimoku [30] | Tenkan line (9) crosses above Kijun line (26) | Crosses below |
| Donchian channel (20) [31] | Close breaks above the previous 20 candles' highest high | Breaks below their lowest low |
Figure 1 shows what the eight candlestick patterns look like. Their exact shape rules follow Nison's definitions [17], with one simplification: patterns that call for a gap between candles accept "at or beyond the previous close" instead, because intraday candles rarely gap.
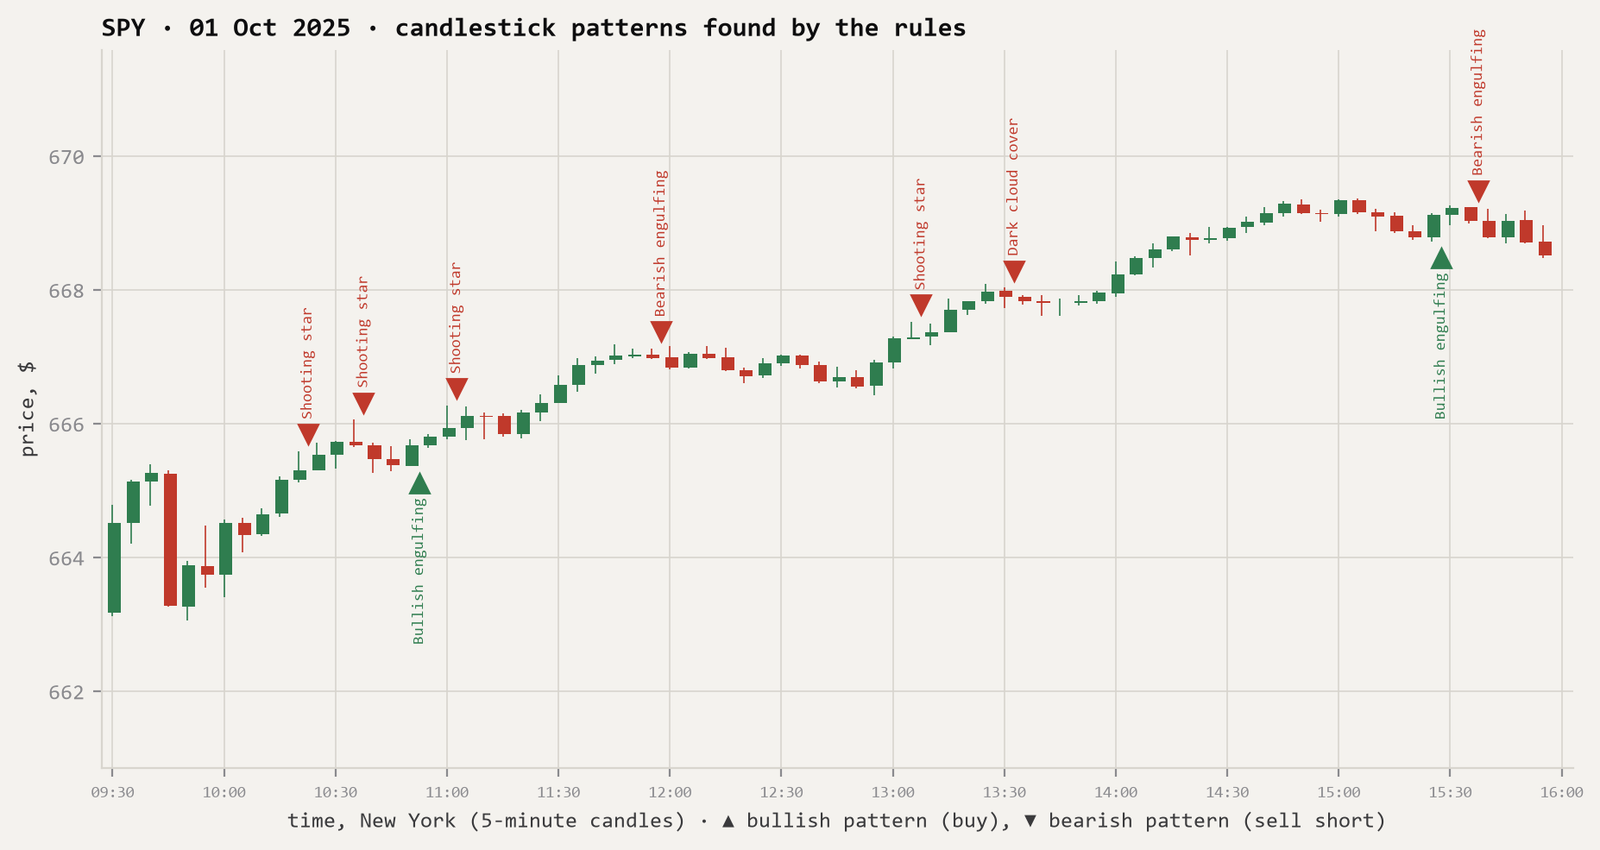
All indicators were checked against separately written versions: RSI, +DI and ADX agreed to within \( 10^{-13} \) over 37,876 five-minute candles, and Bollinger, stochastic and Ichimoku values matched exactly at spot checks. Four detected candlestick patterns and one trade were checked by hand against the raw minute data.
3.2 The trading rule
To compare readings fairly, every one is traded the same way:
- On a buy signal, go long; on a sell signal, go short. Short-selling is assumed possible at the same cost. In practice, brokers may charge borrowing fees or restrict short sales; that is not modelled, and would only make the results worse.
- Enter at the open of the next candle, so no signal uses a price it couldn't have known.
- Exit after 6 candles (6 minutes on 1-minute candles, 30 on 5-minute, 90 on 15-minute), or at 16:00 if sooner. Nothing is held overnight.
- One position at a time per reading and ETF; signals during a trade are ignored.
- Each trade pays 2 bp for the round trip, as in RP-001 and RP-002 [38][39], with results also shown at 0, 5 and 10 bp.
A trade's net return is \( r = d\,(P_{\text{exit}} / P_{\text{entry}} - 1) - c \), where \( d = +1 \) for long and \( -1 \) for short, and \( c \) = 2 bp. Ten readings on three timeframes give 30 strategies, each pooled across the four ETFs.
3.3 Tests
- Does it make money? One-sided t-test on the mean net return per trade, and a Newey–West test on daily returns [35]. Holm-corrected across the 30 [33].
- Does it call direction? Hit rate against 50%, binomial test.
- Coin-flip traders. 10,000 per strategy, taking exactly the same trades (same moments, same holds) but choosing long or short at random. The share the reading beats becomes a p-value, multiplied by 30 for the number of strategies (Bonferroni). This is a simulation test in the spirit of White's reality check [21].
- Random-day traders. 10,000 more that keep each trade's time of day, direction and hold but move it to a random day. This asks whether the reading knows when, not just which way.
- Stability: both years separately, and each ETF separately. Power: the smallest edge each test could reliably detect.
What counts as "works" (fixed in advance): profitable after 2 bp and significant after Holm correction; beats 95% of coin-flip traders after Bonferroni; still profitable at 5 bp; and positive in both years and on at least three of the four ETFs. All four are required.
3.4 How long would it take to know?
Suppose a reading really has the average edge \( \mu \) per trade that it showed here, with trade-to-trade variation \( \sigma \). The number of trades needed to tell that edge from luck, at the usual 5% level with an 80% chance of success, is
Dividing by how often the reading trades on one ETF gives the years of trading needed. This turns "is it worth thousands of hours?" into a number. It is calculated before costs, so it is the most optimistic case; if \( \mu \le 0 \), there is no edge to find.
4. Results
4.1 The P&L
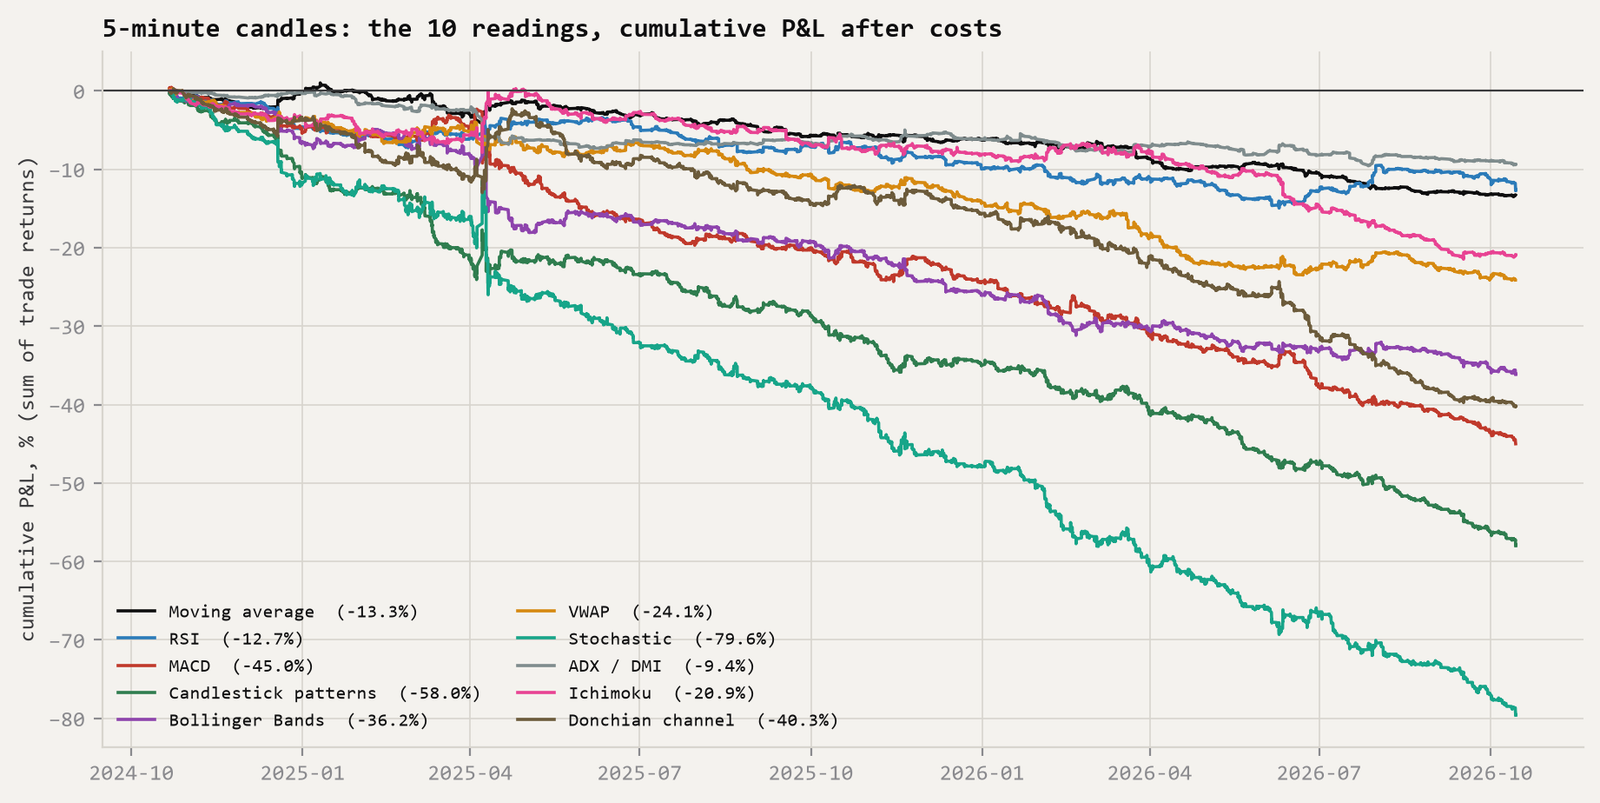
Figure 3 is the headline. On 5-minute candles, every one of the ten readings lost money steadily over two years. The ones that lost most are simply the ones that traded most (the stochastic oscillator made 14,394 trades across the four ETFs; ADX made 1,691): with almost nothing gained before costs, the loss is roughly the cost per trade times the number of trades. The same is true on 1-minute candles (Figure 6) and on 15-minute candles (Table 4).
4.2 Against coin-flip traders
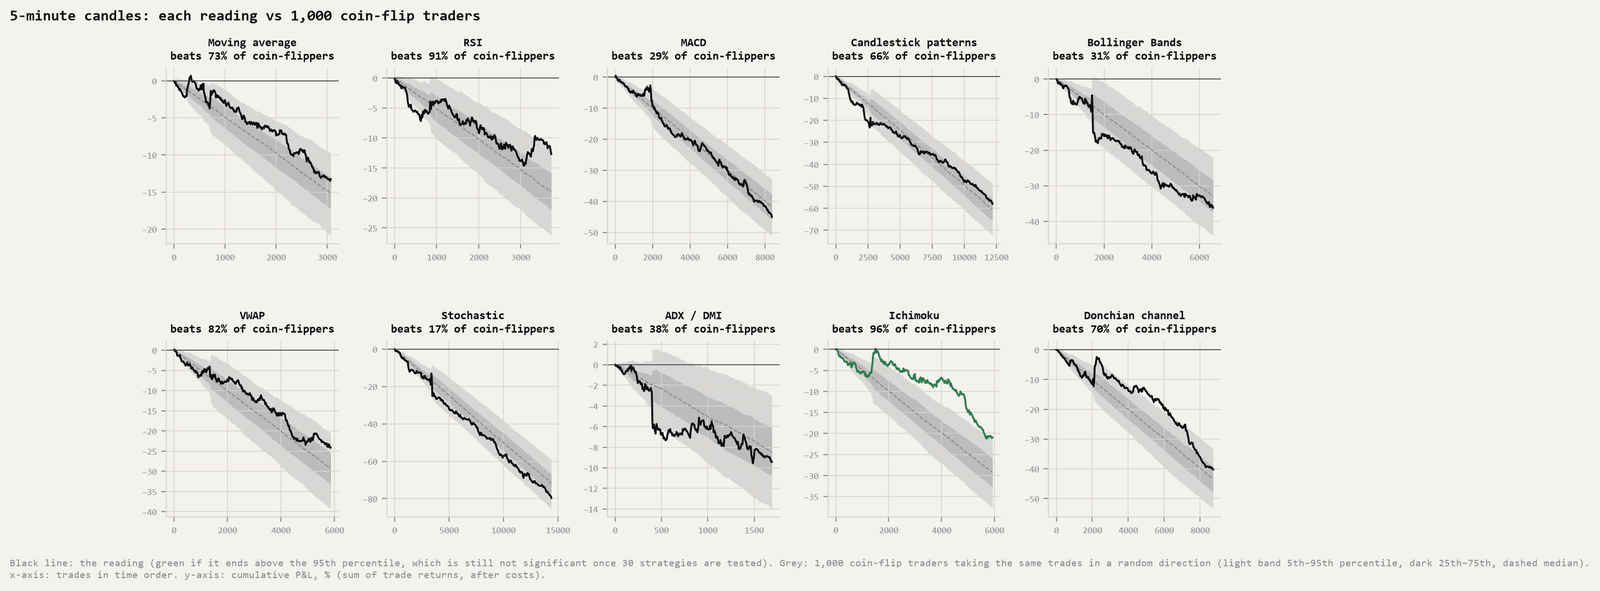
This is the most revealing chart in the paper. The coin-flip traders lose money too, because they pay the same costs. The question is whether each reading's line separates from them. On 5-minute candles, every reading's P&L stays inside or close to the range of its coin flippers. The readings are, in effect, trading at random times in random directions, and paying for it.
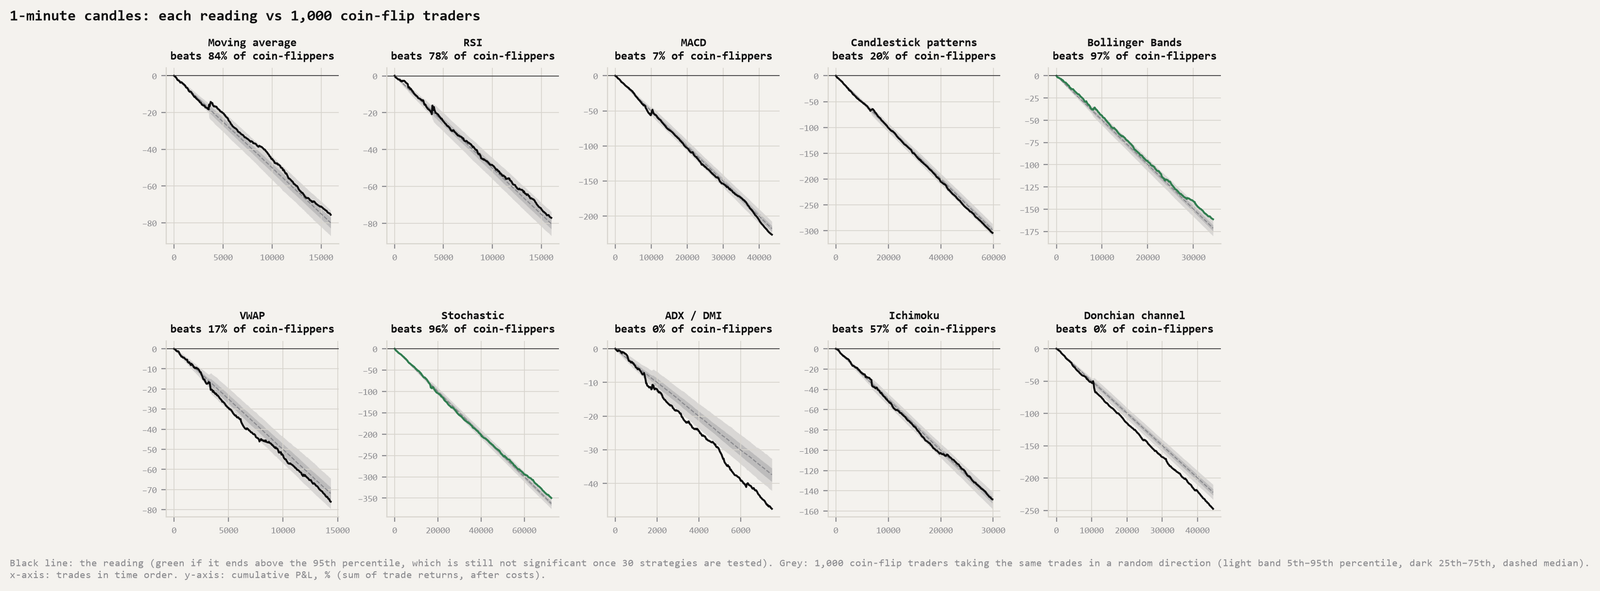
Across all 30 strategies, three beat at least 95% of their coin flippers before any adjustment: Bollinger Bands on 1-minute candles (97.4%), the stochastic oscillator on 1-minute (95.6%) and Ichimoku on 5-minute (95.6%). With 30 strategies, about 1.5 would be expected to do that by luck alone; after the Bonferroni adjustment, the best p-value is 0.78. All three still lost money after costs. At the other extreme, two did significantly worse than flipping a coin: ADX/DMI on 1-minute candles (beat 0.03% of coin flippers) and the Donchian breakout on 1-minute (0.02%). "Worse" was not the direction tested in advance, so these are judged by a stricter two-sided test, adjusted for the 30 strategies: p = 0.018 and 0.012, still significant. The stochastic oscillator on 15-minute candles beat only 1.7%, but that is not significant after adjustment. The random-day traders, who keep each trade's time and direction but move it to a random day, gave the same picture: the share beaten differed from the coin-flip result by at most 3.8 percentage points (median 1.0).
The 1-minute pattern has a plausible explanation. Trend and breakout signals did worse than chance there, while signals that bet on reversals (Bollinger, stochastic, RSI) did slightly better. That fits very-short-term reversal in trade prices, part of which is the well-known "bid-ask bounce": trade prices flick between the bid and the ask, so a price that just ticked up tends to tick back [36]. That effect is real but tiny, about 0.1 bp per trade here, and a trader who has to cross the spread to act on it pays far more than it is worth.
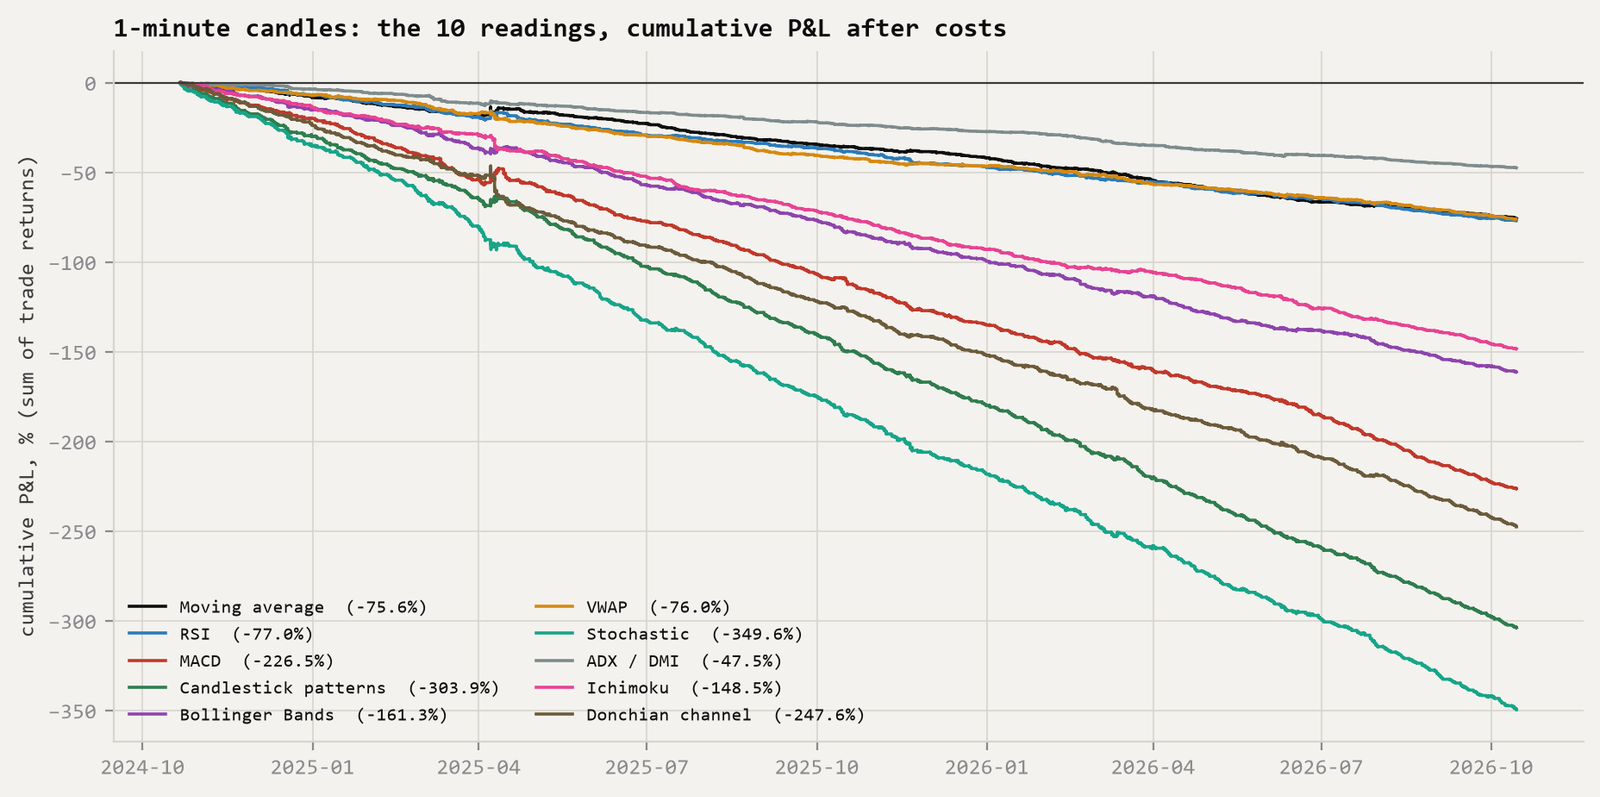
4.3 All 30 at a glance
Table 4. Mean net return per trade (bp, after 2 bp costs) and hit rate, pooled over the four ETFs. Trades per ETF per day in brackets.
| Reading | 1-min | 5-min | 15-min | Hit rate range |
|---|---|---|---|---|
| Moving average | −1.9 [8.1] | −1.7 [1.6] | −3.1 [0.5] | 50.2–52.0% |
| RSI | −1.9 [8.1] | −1.4 [1.9] | −1.3 [0.7] | 48.8–50.3% |
| MACD | −2.1 [22.1] | −2.2 [4.3] | −3.1 [1.4] | 48.9–49.5% |
| Candlestick patterns | −2.0 [30.3] | −1.9 [6.2] | −2.6 [2.1] | 48.3–49.9% |
| Bollinger Bands | −1.9 [17.4] | −2.2 [3.3] | −1.5 [1.2] | 48.2–50.1% |
| VWAP | −2.1 [7.3] | −1.6 [3.0] | −2.1 [1.5] | 49.1–50.0% |
| Stochastic | −1.9 [36.8] | −2.2 [7.3] | −3.3 [2.5] | 46.5–49.9% |
| ADX / DMI | −2.5 [3.8] | −2.2 [0.9] | −3.6 [0.4] | 47.9–51.0% |
| Ichimoku | −2.0 [15.2] | −1.4 [3.0] | −1.9 [1.0] | 49.4–50.3% |
| Donchian channel | −2.2 [22.6] | −1.8 [4.4] | −2.8 [1.5] | 49.2–50.5% |
Every cell is negative, between −1.3 and −3.6 bp per trade. Before costs, 14 of the 30 were slightly positive and 16 slightly negative, between −1.6 and +0.7 bp: indistinguishable from zero. Hit rates ranged from 46.5% to 52.0%, and none was significantly above 50% (smallest p = 0.11, moving average on 15-minute candles). In 27 of the 30 strategies, not a single ETF was profitable; in the other three, one was.
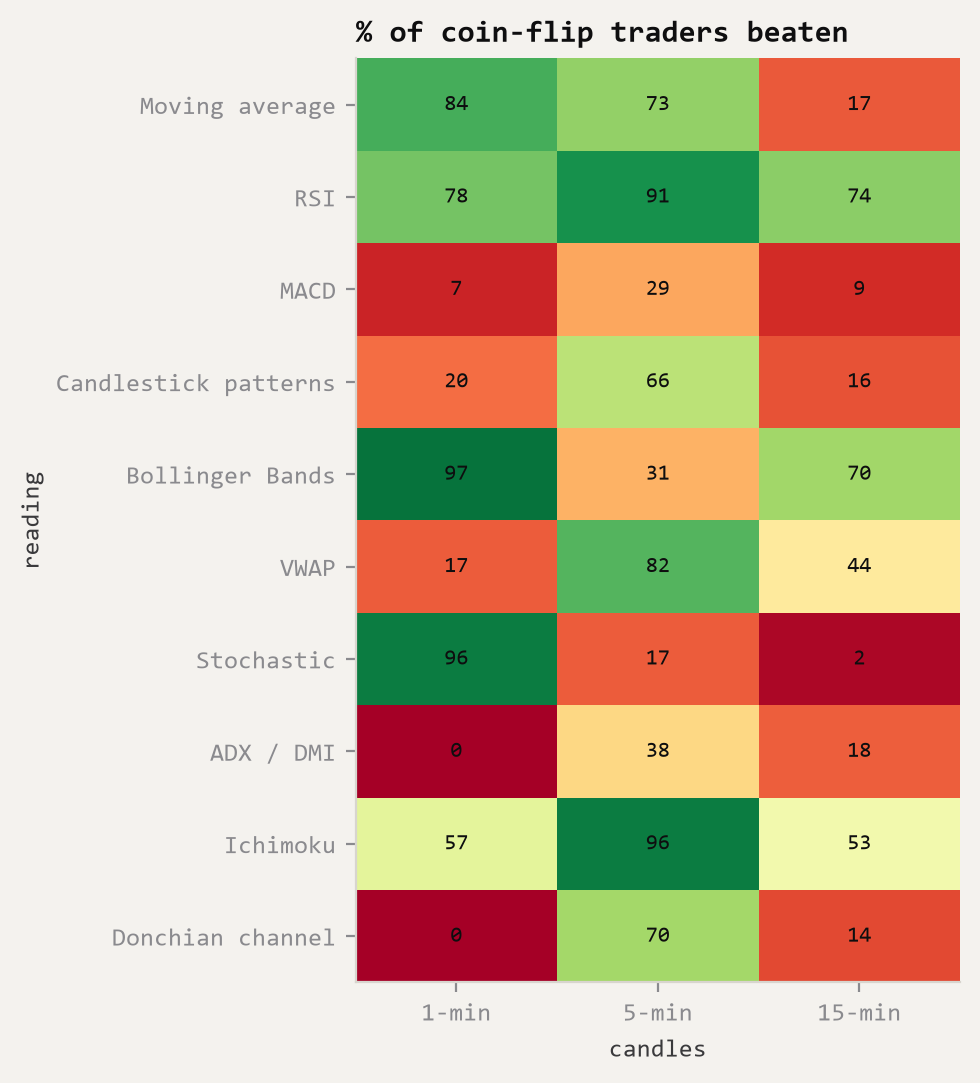
One thing this is not is a lack of data. On 1-minute candles the readings made thousands of trades each, so the tests could detect an edge as small as 0.1–0.4 bp per trade. They found none. On 5- and 15-minute candles the tests were less sensitive (0.5–4.2 bp), but the measured edges were no larger.
4.4 Verdict against the pre-registered criteria
Table 5. Each reading on each timeframe, against the four criteria fixed in advance (criteria passed in brackets).
| Reading | 1-min | 5-min | 15-min |
|---|---|---|---|
| Moving average | no (0/4) | no (0/4) | no (0/4) |
| RSI | no (0/4) | no (0/4) | no (0/4) |
| MACD | no (0/4) | no (0/4) | no (0/4) |
| Candlestick patterns | no (0/4) | no (0/4) | no (0/4) |
| Bollinger Bands | no (0/4) | no (0/4) | no (0/4) |
| VWAP | no (0/4) | no (0/4) | no (0/4) |
| Stochastic | no (0/4) | no (0/4) | no (0/4) |
| ADX / DMI | no (0/4) | no (0/4) | no (0/4) |
| Ichimoku | no (0/4) | no (0/4) | no (0/4) |
| Donchian channel | no (0/4) | no (0/4) | no (0/4) |
Not one of the 30 strategies passed even one criterion. None was profitable after costs, so none could be significant; none beat coin flippers after adjustment; none was profitable at 5 bp; and none was positive in both years on three or more ETFs.
5. How Long Would It Take to Know?
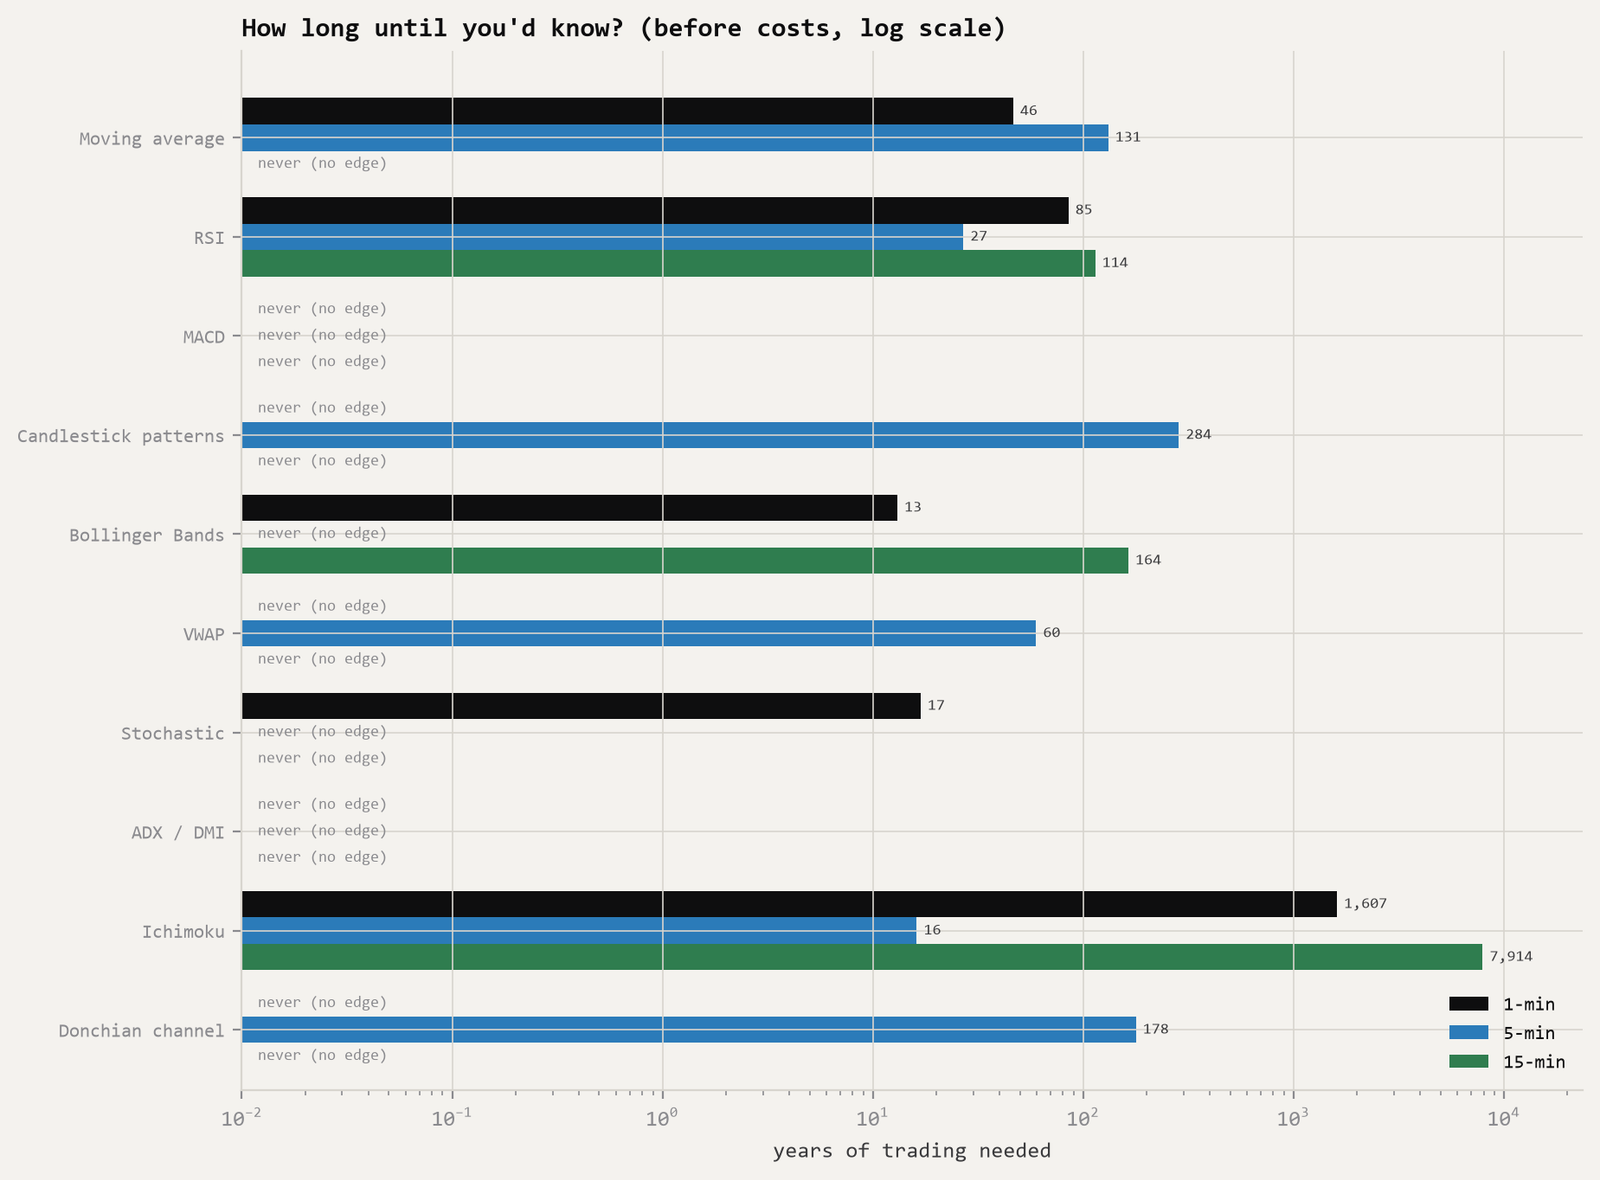
This is the most direct answer to the question in the title. Even with free trading, and even taking each reading's measured edge at face value, the fastest any of them could be told apart from luck is 13 years of trading (Bollinger Bands on 1-minute candles, at about 17 trades a day). The next fastest are 16 years (Ichimoku, 5-minute) and 17 years (stochastic, 1-minute); others run to centuries, and Ichimoku on 15-minute candles to 7,914 years. For 16 of the 30, the answer is "never": they lost money before costs. Trading all four ETFs at once would shorten this, at best to about 3.3 years for the fastest reading, and in practice by less, because the four funds tend to move together and their trades are not independent evidence. A trader practising these readings could spend years, or a career, without learning from their own results whether they had a skill, and that is before costs, which turn every one of them negative.
6. Costs
Table 6. The cost at which each reading stops making money ("break-even", bp per round trip) is simply its average return before costs. The best and worst on each timeframe:
| Timeframe | Highest break-even cost | Lowest | Readings with any positive break-even |
|---|---|---|---|
| 1-min | 0.1 bp (Bollinger) | −0.5 bp (ADX) | 5 of 10 |
| 5-min | 0.6 bp (RSI) | −0.2 bp (ADX) | 6 of 10 |
| 15-min | 0.7 bp (RSI) | −1.6 bp (ADX) | 3 of 10 |
Even if the best measured result were a real edge, which the tests do not show, a trader would need to pay less than 0.7 bp per round trip, all costs included, to profit from it. For these funds, crossing a one-cent spread alone costs 0.15–0.41 bp [6][38], and exchange access fees can add up to $0.003 per share on each side [40]. Trades can sometimes fill inside the spread [7], but broker costs come on top: a UK trader converting pounds to dollars could pay 0.15% each way at one broker [41], which is 30 bp per round trip, about forty times the best break-even found here.
7. Discussion and Limitations
- Mechanical rules, not discretion. Experienced chart readers combine signals, context and judgement. This tests the readings as rules, the way they are taught and the way they appear on charting platforms. It can't rule out that some individual's judgement adds something, but the evidence on real traders (Section 1.4) suggests that is rare.
- One exit rule. Every reading exits after six candles. Readings designed to be held until an opposite signal might do differently. With 3- or 12-candle holds instead (reported in the run files, not tested for significance), 59 of the 60 combinations still lost money after costs; the exception, Bollinger Bands on 15-minute candles held for 12, made +0.25 bp per trade. A fixed hold is what makes the readings comparable.
- Standard settings. No settings were tuned. Searching for better ones is precisely the data-snooping problem that undid earlier findings [20].
- Four index ETFs, two years. These are the most heavily traded, most professionally priced instruments, which is where retail day traders most often are, but also where any easy edge would be found first. Smaller stocks, other markets or other periods could differ.
- How VWAP was computed. Session VWAP was built from each minute's typical price, (high + low + close)/3, times volume. Using the data vendor's own per-minute VWAP instead gives the same signal on 96.9% of 5-minute candles, and VWAP still loses money on every timeframe (−2.15, −1.63 and −1.70 bp per trade on 1-, 5- and 15-minute candles, against −2.12, −1.65 and −2.13 here).
- Trade prices. Fills are at the next candle's opening trade price. Part of the very-short-term behaviour on 1-minute candles may reflect bid-ask bounce in trade prices [36] rather than anything tradable.
- The popularity measure. Wikipedia page views measure how often something is looked up, not how often it is traded. Some articles also serve readers outside trading: "Moving average" is a general statistics topic, and VWAP is also an execution benchmark [32], so their trading popularity may be overstated. Moving averages would still rank highly on narrower measures, but the exact order is approximate. A different measure (search trends, platform usage) could reorder the list, but the readings most likely to be swapped in, such as pivot points and Parabolic SAR, are of the same kind.
- Candle patterns as one reading. Combining eight patterns could hide one that works. With hit rates of 48–50% for the combination on every timeframe, no single pattern would have to be very good for the combination to show it.
- Not independent. The four ETFs move together, and the same reading on different timeframes shares information, so the 30 results are less evidence than 30 separate studies. The adjustments used are conservative in that respect.
8. Conclusion
The ten most popular ways to read a price chart, tested as they are taught on the candles day traders use, did not predict the next move in four of the world's most traded funds. After costs, all 30 combinations lost money. Before costs, they were indistinguishable from zero, and their hit rates were those of a coin. Measured against traders who take the same trades in a random direction, none was reliably better, and two were reliably worse. Even if trading were free, it would take more than a decade of trading, at best, to tell any of them from luck.
So, is day trading by chart reading worth hundreds or thousands of hours to learn? On this evidence, the readings people spend those hours learning don't carry an edge in these markets, and costs guarantee a loss without one. That matches what records of real day traders show: most lose, and few improve with experience [12][13][14]. An edge in day trading, if one exists, would have to come from something other than the patterns everyone can see, and it would need to be tested this way, with costs, random traders and an honest count of the attempts, before anyone spends money on it.
References
Web sources accessed 17 October 2026.
- U.S. Securities and Exchange Commission. Basis points. Investor.gov glossary. investor.gov
- U.S. Securities and Exchange Commission. Exchange-traded fund (ETF). Investor.gov glossary. investor.gov
- Fund issuers' product pages: State Street, SPY; Invesco, QQQ; BlackRock, IWM; State Street, DIA.
- New York Stock Exchange. Holidays & trading hours. nyse.com
- U.S. Securities and Exchange Commission. Bid-ask spread. Investor.gov glossary. investor.gov
- U.S. Securities and Exchange Commission. Responses to frequently asked questions concerning Rule 612 (minimum pricing increment) of Regulation NMS. sec.gov
- Sidley Austin LLP (2024, October). SEC adopts rules modifying minimum pricing increments, access fee caps and order transparency. sidley.com
- Wasserstein, R. L., & Lazar, N. A. (2016). The ASA statement on p-values: Context, process, and purpose. The American Statistician, 70(2), 129–133. doi:10.1080/00031305.2016.1154108
- Sherwood News (2025). Retail share of US trading volume passes 20% in 2025, analyst says (reporting Jefferies estimates). sherwood.news
- MEMX. Retail trading insights. memx.com
- U.S. Securities and Exchange Commission. Payment for order flow. Investor.gov glossary. investor.gov
- Barber, B. M., Lee, Y.-T., Liu, Y.-J., & Odean, T. (2014). The cross-section of speculator skill: Evidence from day trading. Journal of Financial Markets, 18(1). eScholarship
- Chague, F., De-Losso, R., & Giovannetti, B. (2019). Day trading for a living? Working paper, FGV EESP (TD 525). FGV repository
- Barber, B. M., & Odean, T. (2000). Trading is hazardous to your wealth: The common stock investment performance of individual investors. The Journal of Finance, 55(2), 773–806. Author's page
- European Securities and Markets Authority (2018, 27 March). ESMA agrees to prohibit binary options and restrict CFDs to protect retail investors. esma.europa.eu
- Financial Conduct Authority (2019). PS19/18: Restricting contract for difference products sold to retail clients. fca.org.uk
- Nison, S. (1991). Japanese Candlestick Charting Techniques. New York Institute of Finance.
- Marshall, B. R., Young, M. R., & Rose, L. C. (2006). Candlestick technical trading strategies: Can they create value for investors? Journal of Banking & Finance, 30(8), 2303–2323. RePEc
- Brock, W., Lakonishok, J., & LeBaron, B. (1992). Simple technical trading rules and the stochastic properties of stock returns. The Journal of Finance, 47(5), 1731–1764.
- Sullivan, R., Timmermann, A., & White, H. (1999). Data-snooping, technical trading rule performance, and the bootstrap. The Journal of Finance, 54(5), 1647–1691. LSE Research Online
- White, H. (2000). A reality check for data snooping. Econometrica, 68(5), 1097–1126.
- Park, C.-H., & Irwin, S. H. (2007). What do we know about the profitability of technical analysis? Journal of Economic Surveys, 21(4), 786–826. RePEc
- Lo, A. W., Mamaysky, H., & Wang, J. (2000). Foundations of technical analysis: Computational algorithms, statistical inference, and empirical implementation. The Journal of Finance, 55(4), 1705–1765.
- Wikimedia Foundation. Pageviews (Analytics API reference). doc.wikimedia.org; data definitions: wikitech.wikimedia.org
- Wikipedia. Candlestick pattern. en.wikipedia.org
- Wilder, J. W., Jr. (1978). New Concepts in Technical Trading Systems. Greensboro, NC: Trend Research (RSI; directional movement and ADX).
- Wikipedia. MACD (created by Gerald Appel in the late 1970s). en.wikipedia.org
- Wikipedia. Bollinger Bands (John Bollinger, 1980s). en.wikipedia.org
- Wikipedia. Stochastic oscillator (George Lane, late 1950s). en.wikipedia.org
- Wikipedia. Ichimoku Kinkō Hyō. en.wikipedia.org
- Wikipedia. Donchian channel (Richard Donchian). en.wikipedia.org
- Berkowitz, S. A., Logue, D. E., & Noser, E. A., Jr. (1988). The total cost of transactions on the NYSE. The Journal of Finance, 43(1), 97–112.
- Holm, S. (1979). A simple sequentially rejective multiple test procedure. Scandinavian Journal of Statistics, 6(2), 65–70.
- Harvey, C. R., Liu, Y., & Zhu, H. (2016). … and the cross-section of expected returns. The Review of Financial Studies, 29(1), 5–68.
- Newey, W. K., & West, K. D. (1987). A simple, positive semi-definite, heteroskedasticity and autocorrelation consistent covariance matrix. Econometrica, 55(3), 703–708.
- Roll, R. (1984). A simple implicit measure of the effective bid-ask spread in an efficient market. The Journal of Finance, 39(4), 1127–1139. PDF
- Massive (formerly Polygon.io). Pricing: Stocks Basic plan, and 1-minute aggregate bars for SPY, QQQ, IWM and DIA. massive.com
- Liu, Y. J. (2026). Buying the Morning Dip: Do Early-Session Falls in US Index ETFs Reverse? (Research Paper RP-001, v1.0). yijie.space/research
- Liu, Y. J. (2026). Tweaking Supertrend: Do Stops, Timing or Filters Give It an Intraday Edge? (Research Paper RP-002, v1.0). yijie.space/research
- U.S. Securities and Exchange Commission (2024). Fact sheet: Regulation NMS: Minimum pricing increments, access fees, and transparency of better priced orders (Release 34-101070). sec.gov (PDF)
- Wise. Trading 212 fees (FX conversion fee of 0.15%). wise.com. Secondary source; check the broker's current fee schedule.
- Bulkowski, T. N. (2008). Encyclopedia of Candlestick Charts. Hoboken, NJ: Wiley.
- Wikipedia. Candlestick chart (history: Homma attribution; Nison 1991; Nison's later doubt). en.wikipedia.org
Appendix A. Reproducibility
| Code | Available on request (quant-lab, code fingerprint 9a7a600905748817; run 20261016-235818_rp003_readings). Re-running reproduced every number exactly. |
|---|---|
| Run files | Per-ETF results, holding-time sensitivity (3 and 12 candles), random-day trader results and the full popularity list are in the run's CSV files. |
| Environment | Python 3.13.3; numpy 2.5.4, pandas 3.0.6, scipy 1.18.1, matplotlib 3.11.2, pyarrow 26.0.0 |
| Random seeds | Coin-flip traders: 3000 + 100 × (timeframe index) + 10 × (reading index); random-day traders: the same plus 1 + ETF index; P&L fans: 5000 + 100 × timeframe index + reading index |
| Price data |
SPY massive-SPY-1min-20261015T173255 · QQQ massive-QQQ-1min-20261015T173723 IWM massive-IWM-1min-20261015T175320 · DIA massive-DIA-1min-20261015T175719 (checksums in RP-001 [38]) |
| Popularity data | wikimedia-PAGEVIEWSRP003-monthly-20261016T234541 (29 articles × 12 months, en.wikipedia, human users) |
| Raw data | Prices not redistributed (provider terms); download from Massive [37]. Page views are public [24]. |
Appendix B. Revision History
| v1.0 — 17 October 2026 | Published. |
|---|---|
| v0.2 — 17 October 2026 | After review: judged the two worse-than-random results with a two-sided adjusted test; gave the random-day comparison numerically; disclosed how VWAP was computed and checked it against the vendor's VWAP; corrected the 5-minute candle check for DIA; noted that two popularity counts include non-trading readers; added the all-four-ETFs case to the time-to-know section; removed an unsupported claim about short-selling costs and softened claims about who retail trades against; removed a conversational aside. Results unchanged. |
| v0.1 — 17 October 2026 | First draft for review. |
Educational research only, not financial advice. Results are historical simulations and do not predict future returns. Corrections are welcome at contact@yijie.space.