Educational research only, not financial advice. Sources were checked on 15 October 2026.
1. Introduction
1.1 The basics, in plain English
This section explains every term the rest of the paper relies on. Readers who trade can skip to 1.2.
| The US trading day | The main US stock exchanges trade from 09:30 to 16:00 New York time, Monday to Friday, apart from holidays and a few shortened days [4]. Orders placed before 09:30 are matched in an opening auction that sets the first price of the day; at the New York Stock Exchange, for example, orders can be entered from 06:30 [5]. |
|---|---|
| Index | A single number that summarises the prices of a fixed list of companies. The S&P 500, for example, covers about 500 large US companies [3]. You can't buy an index itself. |
| Points | The unit an index is quoted in. On 9 April 2025 the S&P 500 closed at 5,456.90 points [20]. "Up 50 points" means the index number rose by 50. Points are not basis points (next row). |
| Basis point (bp) | One hundredth of one percent: 1 bp = 0.01% = 1/10,000 [1]. Finance uses basis points because the numbers involved are small. On a £1,000 trade, 1 bp is 10p; 58.8 bp is 0.588%, or £5.88. Every return in this paper is in basis points per trade. |
| ETF | An exchange-traded fund: a fund that holds a basket of shares and is itself bought and sold on a stock exchange like a single share [2]. Index ETFs hold the companies in an index, so their price follows it. This paper uses four: SPY tracks the S&P 500, QQQ the Nasdaq-100, IWM the Russell 2000 (smaller companies) and DIA the Dow Jones Industrial Average (30 large companies) [3]. |
| Return | The percentage gain or loss on a trade: (sell price ÷ buy price) − 1. Buying at $100 and selling at $100.50 is a return of 0.5%, or 50 bp. |
| Candlestick (1-minute bar) | How the charts in this paper draw prices. Each candle covers one minute and shows four prices: the open (first trade of that minute), the close (last trade), and the high and low (the thin line). Green means the minute closed higher than it opened; red, lower. |
| Bid, ask and spread | At any moment the best price someone will pay is the bid and the best price someone will sell at is the ask; the gap between them is the spread [6]. Buying immediately means paying the ask and selling immediately means accepting the bid, so a round trip loses up to one spread. For shares priced above $1, US rules have required quotes in whole cents, so the quoted spread can't be narrower than one cent [7]; trades themselves can happen in between, which can make the real cost smaller [32]. |
| Trading costs | Everything paid to trade apart from the price itself: the spread, exchange fees, broker commission, currency conversion. This paper expresses them in basis points of the trade's size and deducts them from every trade. |
| The dip, and x, k, h | A dip here means the price is below that day's 09:30 opening price. The rule has three settings: the buy-in time x (how many minutes after 09:30 to check), the dip size k (how far below the open counts as a dip, in %), and the holding time h (how many minutes to hold before selling). |
| In-sample and out-of-sample | The data is split in two. The first year (in-sample) is used to choose the settings. The second year (out-of-sample) is kept unseen and used once, to check whether those settings still work on data they weren't chosen from. |
| t-statistic and p-value | Measures of how distinguishable an average return is from zero, given how much individual trades vary. A p-value is roughly how often a result at least this good would appear by chance if the rule really earned nothing on average. Below 0.05 is a common, imperfect threshold for "significant"; a p-value is not the probability that the idea is true [8]. |
| Random traders | Simulated traders who make the same number of trades, with the same holding time, but ignore the dip. In the main version they buy at the same time of day as the rule, on randomly chosen days. Comparing the dip rule against 10,000 of them asks: does waiting for a dip actually help? |
| Statistical power | How big an effect a test is able to detect. With few trades that vary a lot, only a large edge would show up as significant; a small real edge could go unnoticed. |
1.2 The question
The first half-hour of the US trading day is unusually volatile: prices swing more around the open (and the close) than in the middle of the day, a pattern documented for decades in US and European markets [9][10]. One intraday trading idea says that when an index fund drops hard early in the session, the drop is an overreaction: buy it, hold it for a short while, and collect the bounce.
There are reasons on both sides. In Grossman and Miller's model of market making, traders who take the other side of a sudden wave of orders are compensated through later price movements, which would support a reversal [11]. Against that, research on intraday momentum finds that the market's first half-hour return predicts the direction of its last half-hour [12], and that returns at a given time of day tend to repeat across days [13]. Whether an early dip reverses or continues is therefore a genuine empirical question.
This paper turns the idea into a precise rule and tests it on two years of minute-by-minute data. Figure 1 shows the rule on a single real day.
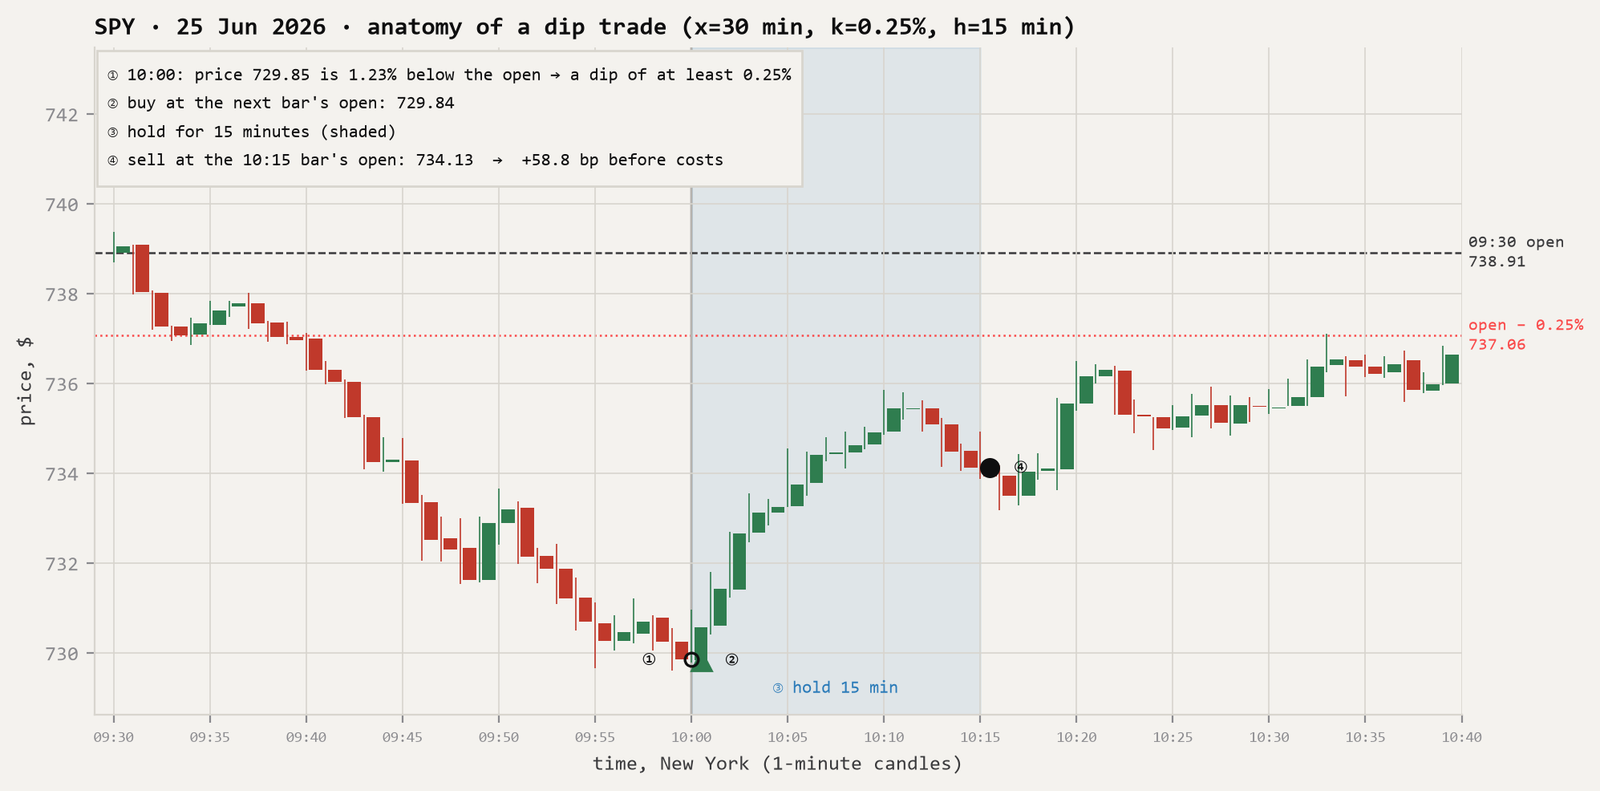
Formally, I test:
The design, including the parameter grid, the selection rule, the costs and the criteria for abandoning the idea, was written down before any results were seen. One amendment was made, also before results, when long-history minute data turned out not to be available for free (Section 2).
2. Data
| Source | Massive (formerly Polygon.io), free Stocks Basic plan: 1-minute bars, two years of history [17] |
|---|---|
| Instruments | SPY, QQQ, IWM and DIA [3], standing in for the indexes they track |
| Frequency | 1-minute bars (open, high, low, close and volume of trades) |
| Full period | 21 October 2024 to 14 October 2026: 492 regular trading days per ETF |
| In-sample | 21 October 2024 to 30 September 2025 (233 days): used only to choose settings |
| Out-of-sample | 1 October 2025 to 14 October 2026 (259 days): evaluated once |
| Session | Regular hours only, 09:30–16:00 New York [4] (390 one-minute bars). Pre- and after-market bars discarded. |
| Adjustments | Adjusted for share splits, not for dividends. This can't affect the results: dividend entitlement is decided by the ex-dividend date, which changes between trading days [19], and every trade here opens and closes within a single day. |
| Cleaning | 5 shortened trading days (e.g. 24 December) removed from each ETF. Bar coverage 100% for SPY, QQQ and IWM, 99.7% for DIA; a missing minute is filled with the previous close. |
| Validation | For all four ETFs, the 09:30 opening price in the minute data matches Yahoo Finance's independently published daily opening price [30] within 0.25 bp on all 492 days (median difference under 0.001 bp). |
| Market backdrop | A mostly rising market. From the first open to the last close, SPY rose 31.8%, QQQ 47.8%, IWM 20.3% and DIA 19.2% (price only, from this data). Almost all of that rise happened overnight: the average move from 09:30 to 16:00 was between −0.2 and +1.8 bp per day, under 0.15 bp per half-hour. The sample includes the April 2025 tariff turmoil, when the S&P 500 rose 9.5% in one day on 9 April [20]. |
Amendment. The original design used 1-minute data from January 2007, to compare behaviour in the 2008 financial crisis, the COVID crash and later periods. No free source provides minute data that far back: Alpha Vantage, which offers 20+ years of intraday history [18], answered every intraday request on a free key with "This is a premium endpoint" when tested on 15 October 2026. The study was therefore re-scoped, before any results, to the two years available on Massive's free plan [17], with a split at 1 October 2025 and a quarter-by-quarter stability check in place of the crisis comparisons. An earlier development run had used Yahoo 5-minute data from July–October 2026, which overlaps the out-of-sample year; no settings were chosen from it.
3. Methodology
3.1 The trading rule
Let \( O_{d,m} \) and \( C_{d,m} \) be the open and close of the 1-minute bar that starts m minutes after 09:30 on day d. The move since the open, measured x minutes in, is
using the close of the bar that ends exactly at 09:30 + x. If \( M_d(x) \le -k \), the rule buys at the open of the next bar and sells at the open of the bar h minutes later. The trade's net return is
Buying at the next bar's open, rather than at the price that triggered the signal, means the rule never uses a price it couldn't have known in time. There is at most one trade per ETF per day, and nothing is held overnight.
3.2 Varying the intervals
The rule has three settings, and nothing says in advance which values are right. I tested every combination of:
| Buy-in time, x | 5, 10, 15, 30 or 60 minutes after the open |
|---|---|
| Dip size, k | 0.25%, 0.5%, 0.75%, 1% or 1.5% below the open |
| Holding time, h | 15, 30, 60 or 120 minutes |
| Total | 5 × 5 × 4 = 100 combinations per ETF, 400 in all |
For each ETF, the combination with the highest in-sample t-statistic, among those with at least 30 in-sample trades, was selected. Only 72 of the 400 combinations had that many trades, because large dips are rare. The selected combination was then run once on the out-of-sample year with no further changes. Trying many settings and keeping the best is one of the main ways backtests mislead [15], so the two years were kept strictly separate, and in-sample p-values were corrected for the 100 attempts per ETF (Section 3.4).
3.3 Costs and assumptions
| Cost | 2 bp per round trip (buy and sell together), deducted from every trade; sensitivity at 0, 5 and 10 bp. Section 6 explains what this does and doesn't cover. |
|---|---|
| Execution | Market orders, filled at the bar's opening trade price. No market-impact model; positions are assumed small. |
| Sizing | Every trade is the same size; returns are per trade, not compounded across ETFs. |
| Benchmark | The same entry time and holding time on every day, with no dip filter. This separates the effect of the dip from the effect of simply trading at that time of day. |
3.4 Statistical tests
t-test. A one-sided test of whether the mean net return per trade is above zero. In-sample p-values are adjusted with the Holm–Bonferroni method [14] across the 100 combinations per ETF: with 100 attempts, about five would pass the 0.05 threshold by chance alone, a problem that is widespread in published finance research [15].
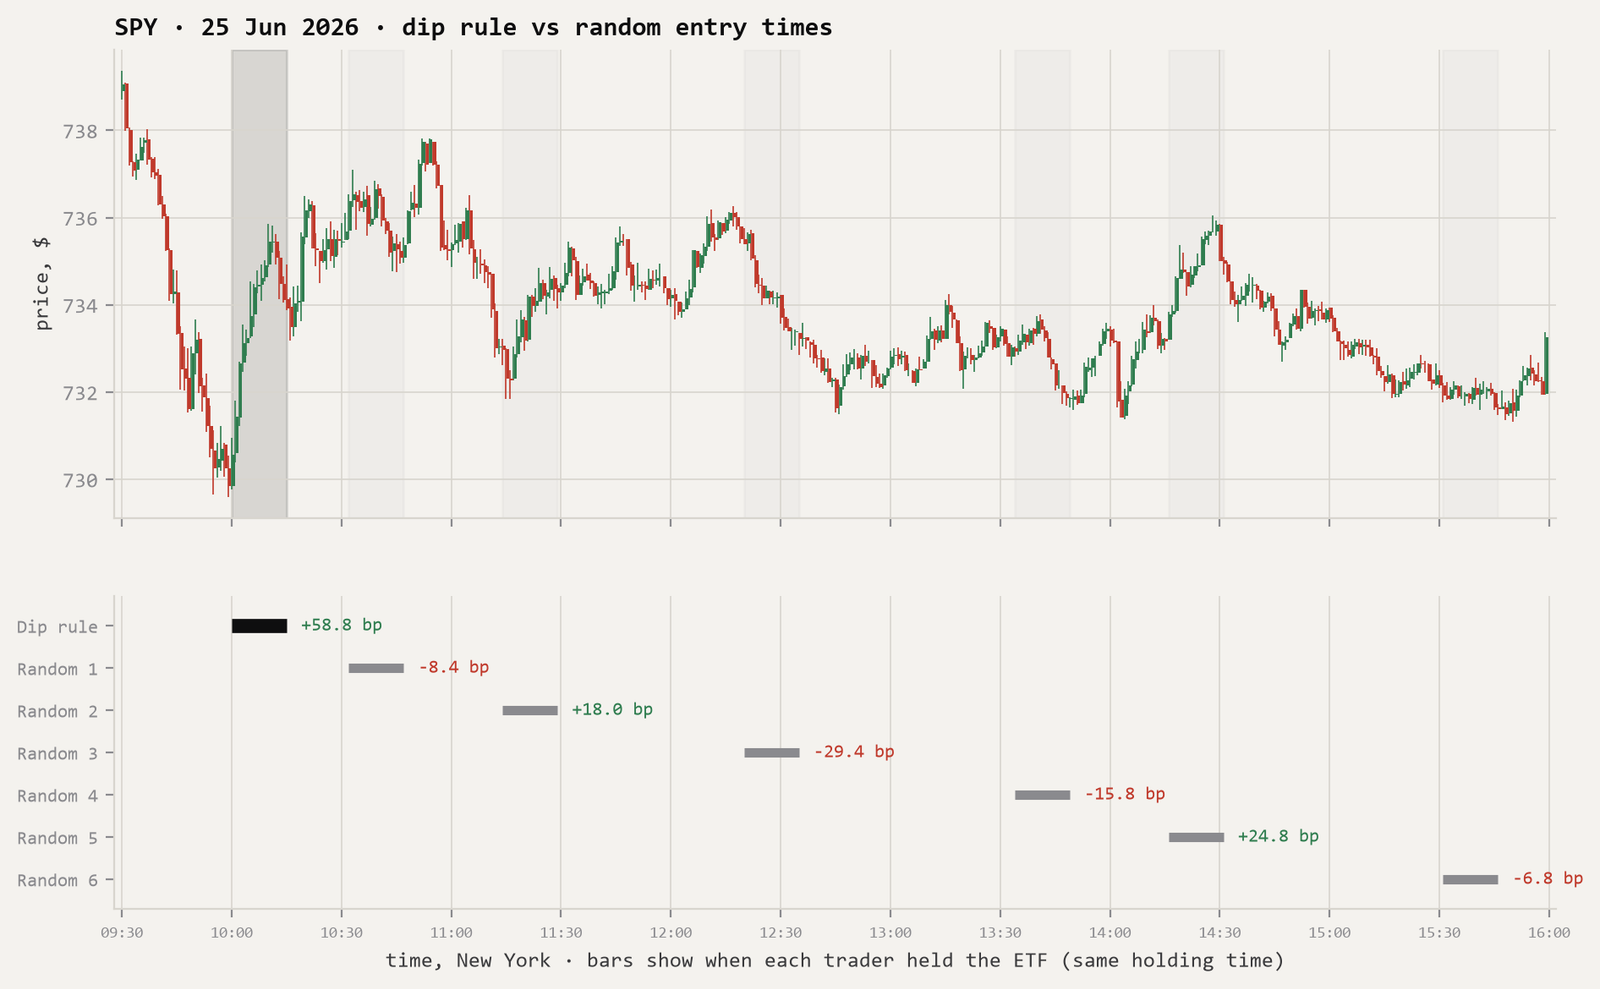
Random traders. A t-test asks whether the rule makes money. The random-trader test asks a different question: does buying on a dip beat buying without one? For each ETF, I simulate 10,000 traders. Each makes exactly as many trades as the dip rule did out-of-sample, holds each one for the same h minutes, pays the same 2 bp, and differs only in when it buys. Three versions were run:
- Same entry time, random days (the main comparison): each trade is entered at exactly the rule's time, 09:30 + x, on a randomly chosen out-of-sample day, whether or not the price dipped. This isolates the one thing the rule adds, the dip filter.
- Random day & time: each trade is on a random out-of-sample day, entered at a random minute between 09:35 and the latest time that still allows an h-minute hold before 16:00.
- Same days, random time: each trade is on one of the dip rule's own days, entered at a random minute.
Amendment after results. Only the last two were specified in advance. Reviewing the first results showed they are unfair to the comparison in the rule's favour. The dip rule always trades in the first two to three hours, when prices move more than at midday [9][10], while random-time traders mostly trade calmer minutes. In this data a single dip trade's return varied by 23–54 bp (standard deviation), against 12–37 bp for random-time trades. Calmer trades make the random traders' averages cluster more tightly, so any lucky result looks more exceptional than it is. The time-matched comparison was therefore added after the results were seen. It makes the findings weaker, not stronger, and all three are reported.
Figure 2 shows the idea on a single day. The result is the share of random traders whose average return per trade the dip rule beat:
Beating 50% means doing no better than chance; beating 95% corresponds to a one-sided p-value of 0.05. Because four ETFs were tested, these p-values are also reported multiplied by four (a Bonferroni adjustment), which is conservative here because the four funds hold many of the same companies and tend to dip on the same days [3]. This is a simulation-based test in the spirit of White's reality check [16], and it needs no assumptions about the shape of the return distribution.
4. Results
Table 1. Selected settings per ETF (chosen on the in-sample year) and their out-of-sample results, net of 2 bp per round trip. "No filter" is the same entry and hold on every out-of-sample day. Returns in basis points per trade (1 bp = 0.01%).
| ETF | x / k / h | IS trades | IS Holm p | OOS trades | OOS mean | t-stat | p-value | Win rate | No filter |
|---|---|---|---|---|---|---|---|---|---|
| SPY | 30 / 0.25% / 15 | 40 | 1.000 | 41 | 0.0 | 0.00 | 0.499 | 51% | −2.7 |
| QQQ | 60 / 0.5% / 60 | 42 | 1.000 | 45 | 2.6 | 0.33 | 0.372 | 51% | −2.7 |
| IWM | 10 / 0.25% / 60 | 54 | 1.000 | 61 | −0.1 | −0.02 | 0.506 | 57% | −2.4 |
| DIA | 15 / 0.25% / 30 | 30 | 1.000 | 52 | 4.8 | 1.26 | 0.107 | 56% | −1.2 |
Three things stand out. First, even the best in-sample combinations were weak: the strongest in-sample t-statistic was 1.33 (IWM), and after correcting for 100 attempts no combination for any ETF came close to significance (smallest adjusted p = 0.45). The selection step was choosing among noise. Second, out-of-sample, the four selected rules averaged between −0.1 and +4.8 bp per trade, and none was significantly above zero. Third, every rule did better than trading at the same time without the filter (−1.2 to −2.7 bp, which is mostly the 2 bp cost itself). So buying on a dip was slightly better than buying blindly, but not by enough to be confident.
How big an edge could this test have found? With 41–61 trades per ETF and single trades varying by 23–54 bp, the out-of-sample test had an 80% chance of detecting a true average edge of 8.8 bp (SPY), 9.5 bp (DIA), 16.8 bp (IWM) or 19.9 bp (QQQ) per trade, at the 5% significance level. Edges smaller than that, including any that would cover realistic costs and still be worth trading, could easily go undetected. A null result here therefore rules out a large edge, not a small one.
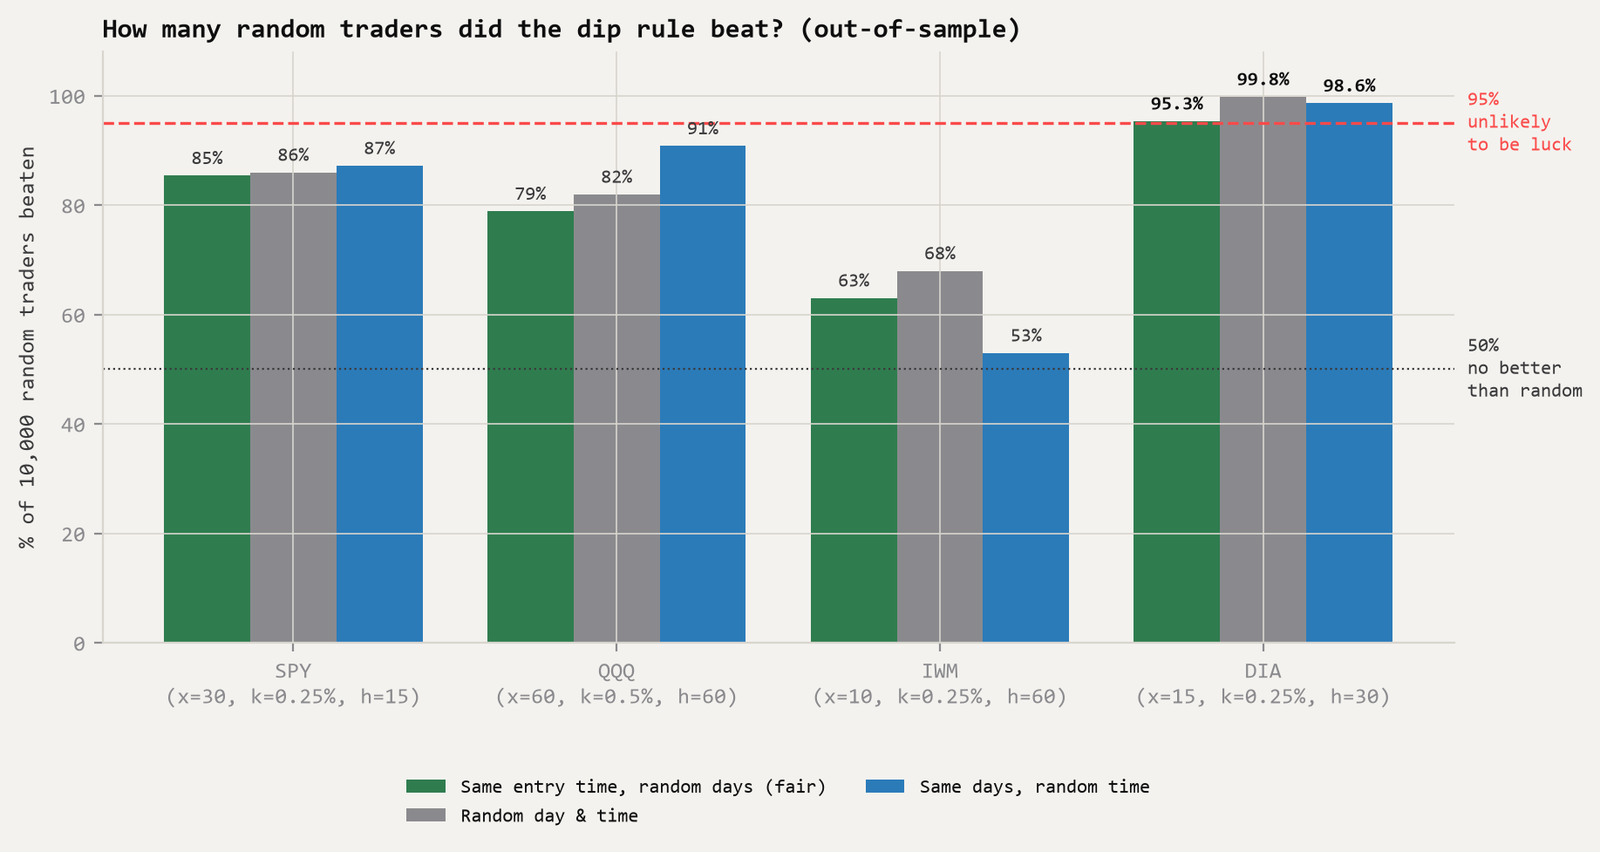
Table 2. Share of 10,000 random traders beaten, out-of-sample, and the one-sided p-value of the time-matched comparison before and after adjusting for four ETFs.
| ETF | Same time, random days | p | p × 4 ETFs | Random day & time | Same days, random time |
|---|---|---|---|---|---|
| SPY | 85.4% | 0.146 | 0.58 | 86.0% | 87.2% |
| QQQ | 78.9% | 0.211 | 0.85 | 82.0% | 90.8% |
| IWM | 63.0% | 0.370 | 1.00 | 68.0% | 53.0% |
| DIA | 95.3% | 0.047 | 0.19 | 99.8% | 98.6% |
On the fair, time-matched comparison, SPY, QQQ and IWM beat 63–85% of random traders: better than chance on average, but nowhere near convincing. DIA beat 95.3%, just over the usual line on its own (p = 0.047). But four ETFs were tested, and the chance that at least one of four would clear the 95% line by luck alone is about 19%; after adjusting for that, DIA's p-value is 0.19, not significant. The original, whole-day comparisons put DIA at 99.8% and 98.6%, which looked far more impressive; most of that gap comes from the unfair comparison described in Section 3.4, not from the rule. Figure 4 shows the difference directly.
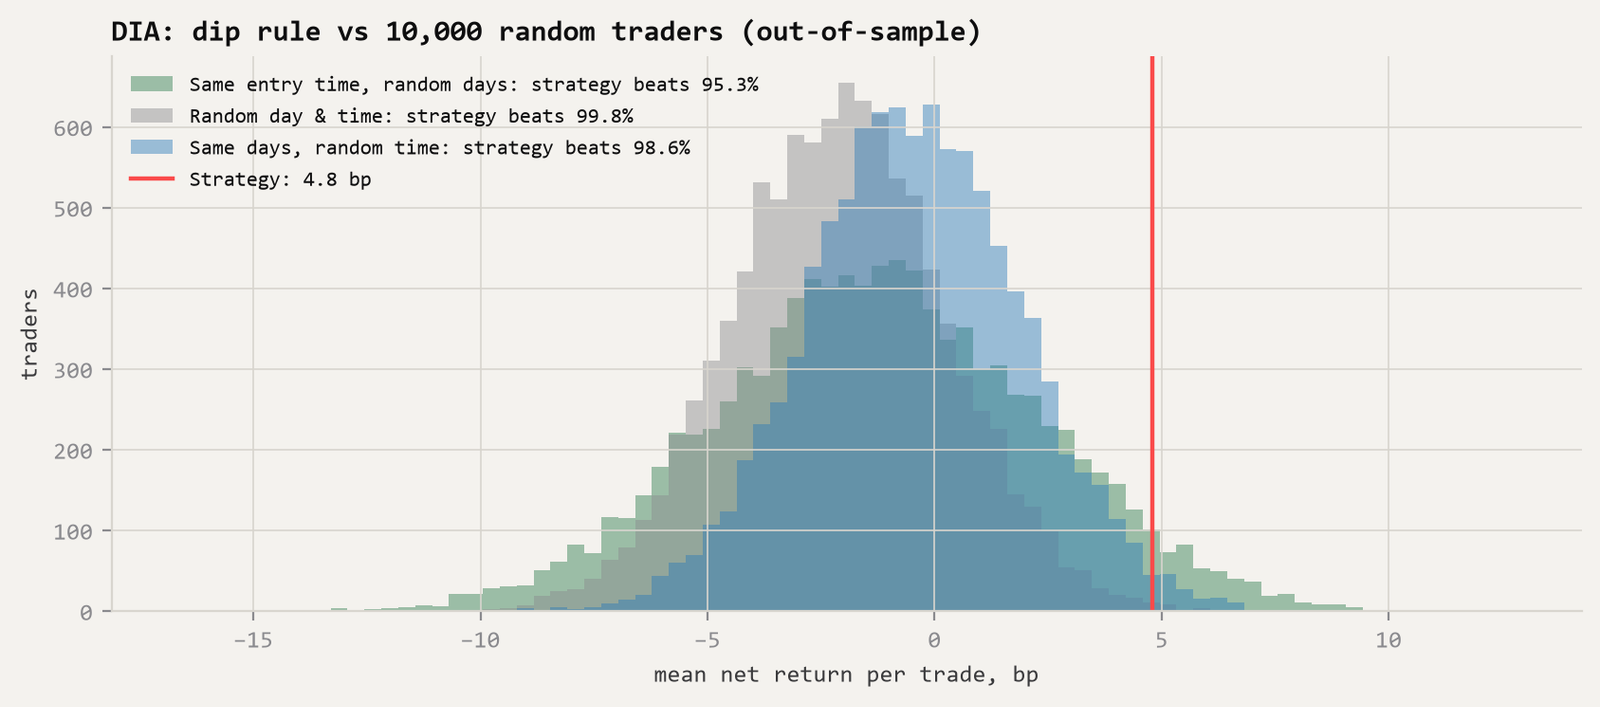
This also resolves what looked like a contradiction in the first draft: DIA's t-test is not significant (p = 0.11), yet the whole-day comparisons put it ahead of 98.6–99.8% of random traders. Measured against traders who face the same early-session volatility, the two tests broadly agree: DIA's result is borderline on its own and not significant once the number of ETFs tested is accounted for. In plain terms: DIA's dip rule did slightly better than trading at the same time without the dip filter, but neither test shows that it reliably makes money.
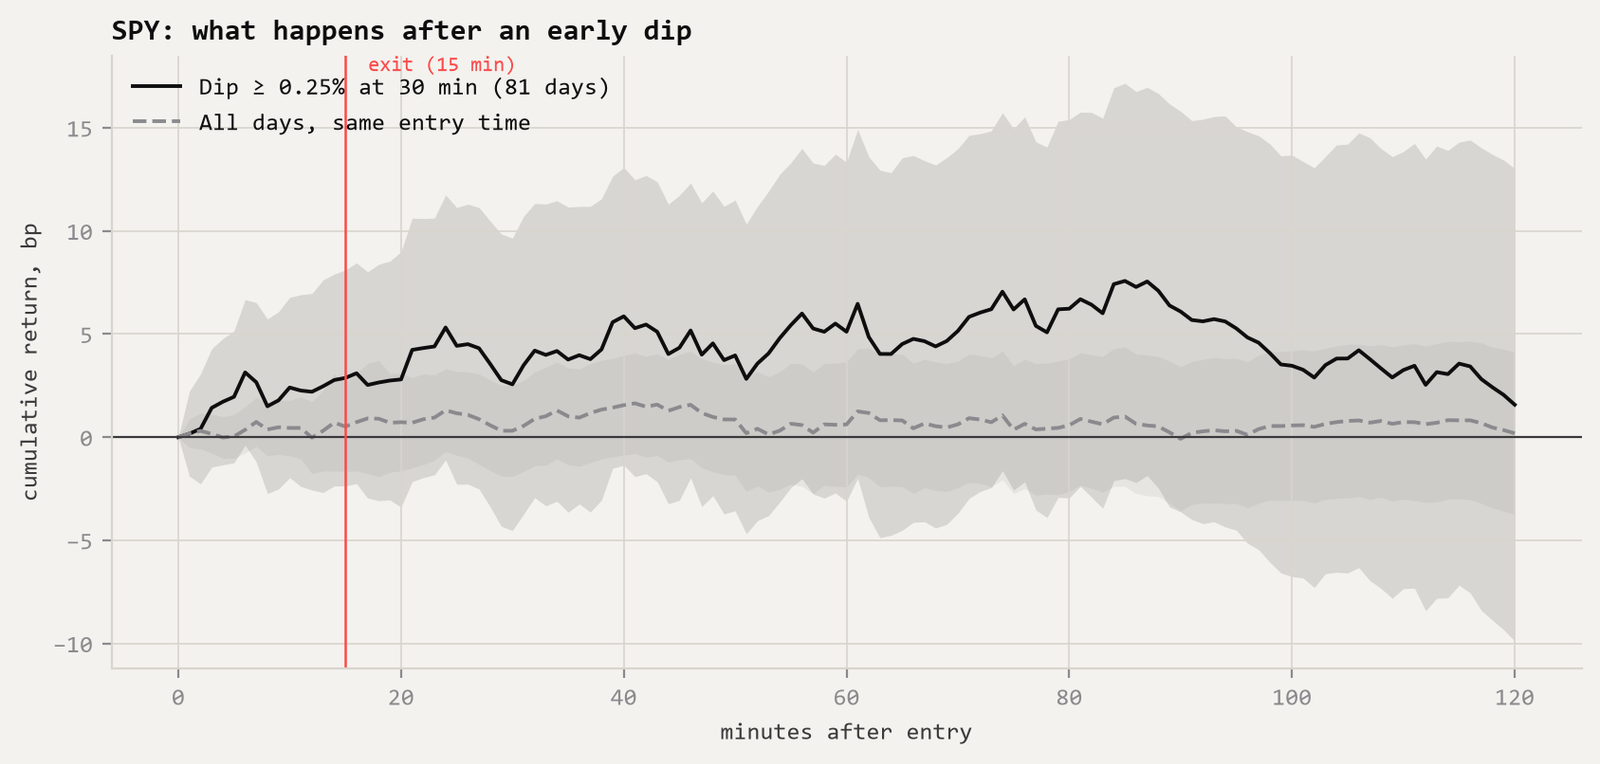
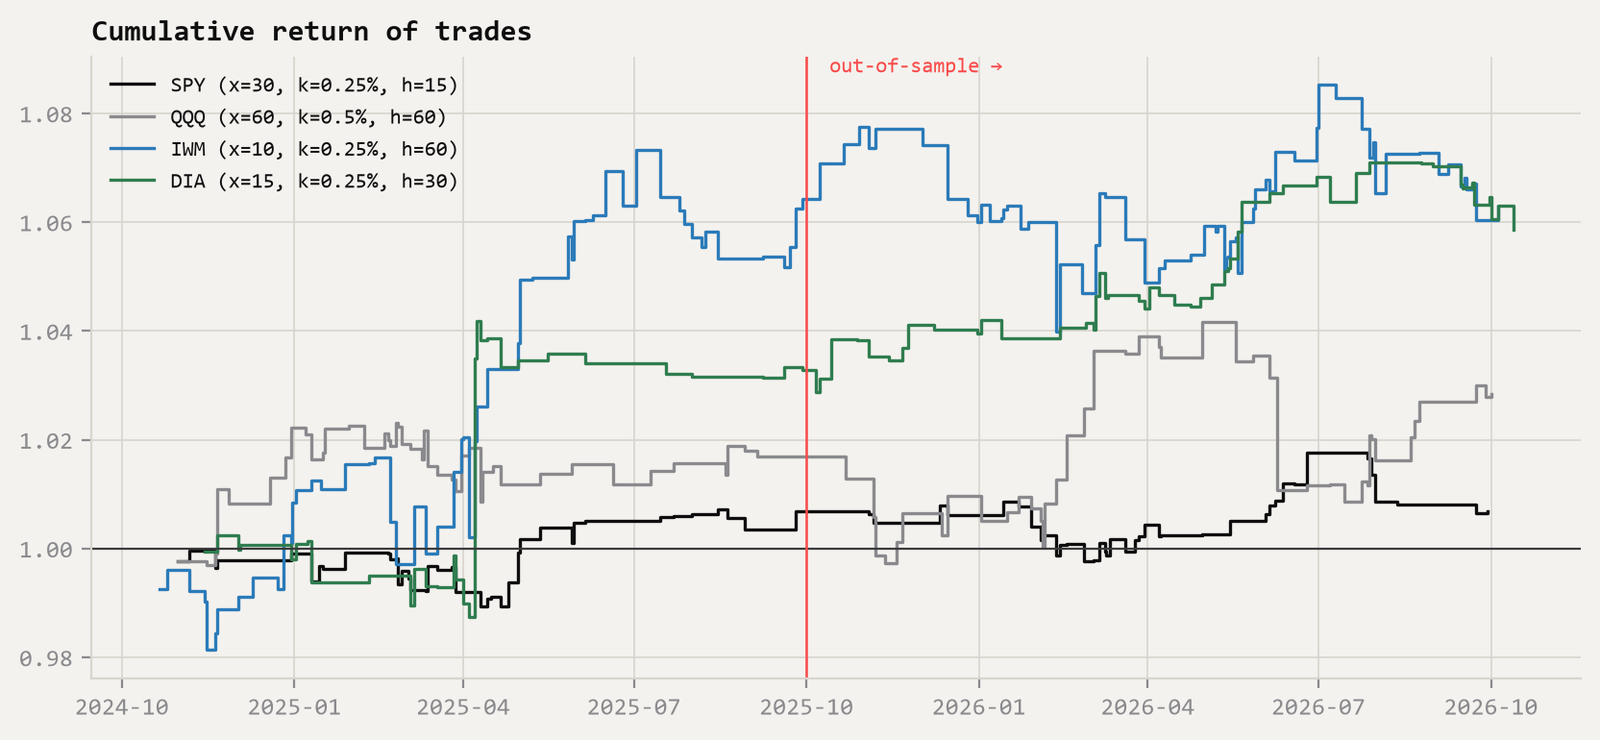
4.1 Verdict against the pre-registered criteria
Before testing, three criteria were written down for abandoning the idea for an ETF: the out-of-sample result isn't significant; it doesn't beat 95% of random traders (same days, random time); or it stops making money at 5 bp of costs. Failing any one means dropping it. Row 2b applies the fairer, time-matched comparison added after review.
Table 3. Each ETF against the pre-registered drop criteria.
| Criterion | SPY | QQQ | IWM | DIA |
|---|---|---|---|---|
| 1. Out-of-sample t-test p < 0.05 | fail | fail | fail | fail |
| 2a. Beats 95% of random traders (as pre-registered) | fail | fail | fail | pass |
| 2b. Beats 95% of time-matched random traders, adjusted for 4 ETFs | fail | fail | fail | fail |
| 3. Still positive at 5 bp cost | fail | fail | fail | pass |
| Verdict | drop | drop | drop | drop |
By the rules set in advance, the idea is dropped for all four ETFs. DIA comes closest, passing two of the original three criteria, but it fails the first and, on the fairer comparison, the second as well.
5. Robustness
5.1 Buy-in time × holding time
The selection picked one combination per ETF, but the full grid tells a more complete story. Figure 7 shows every buy-in time and holding time at each ETF's selected dip size, in both years, alongside the no-filter baseline.
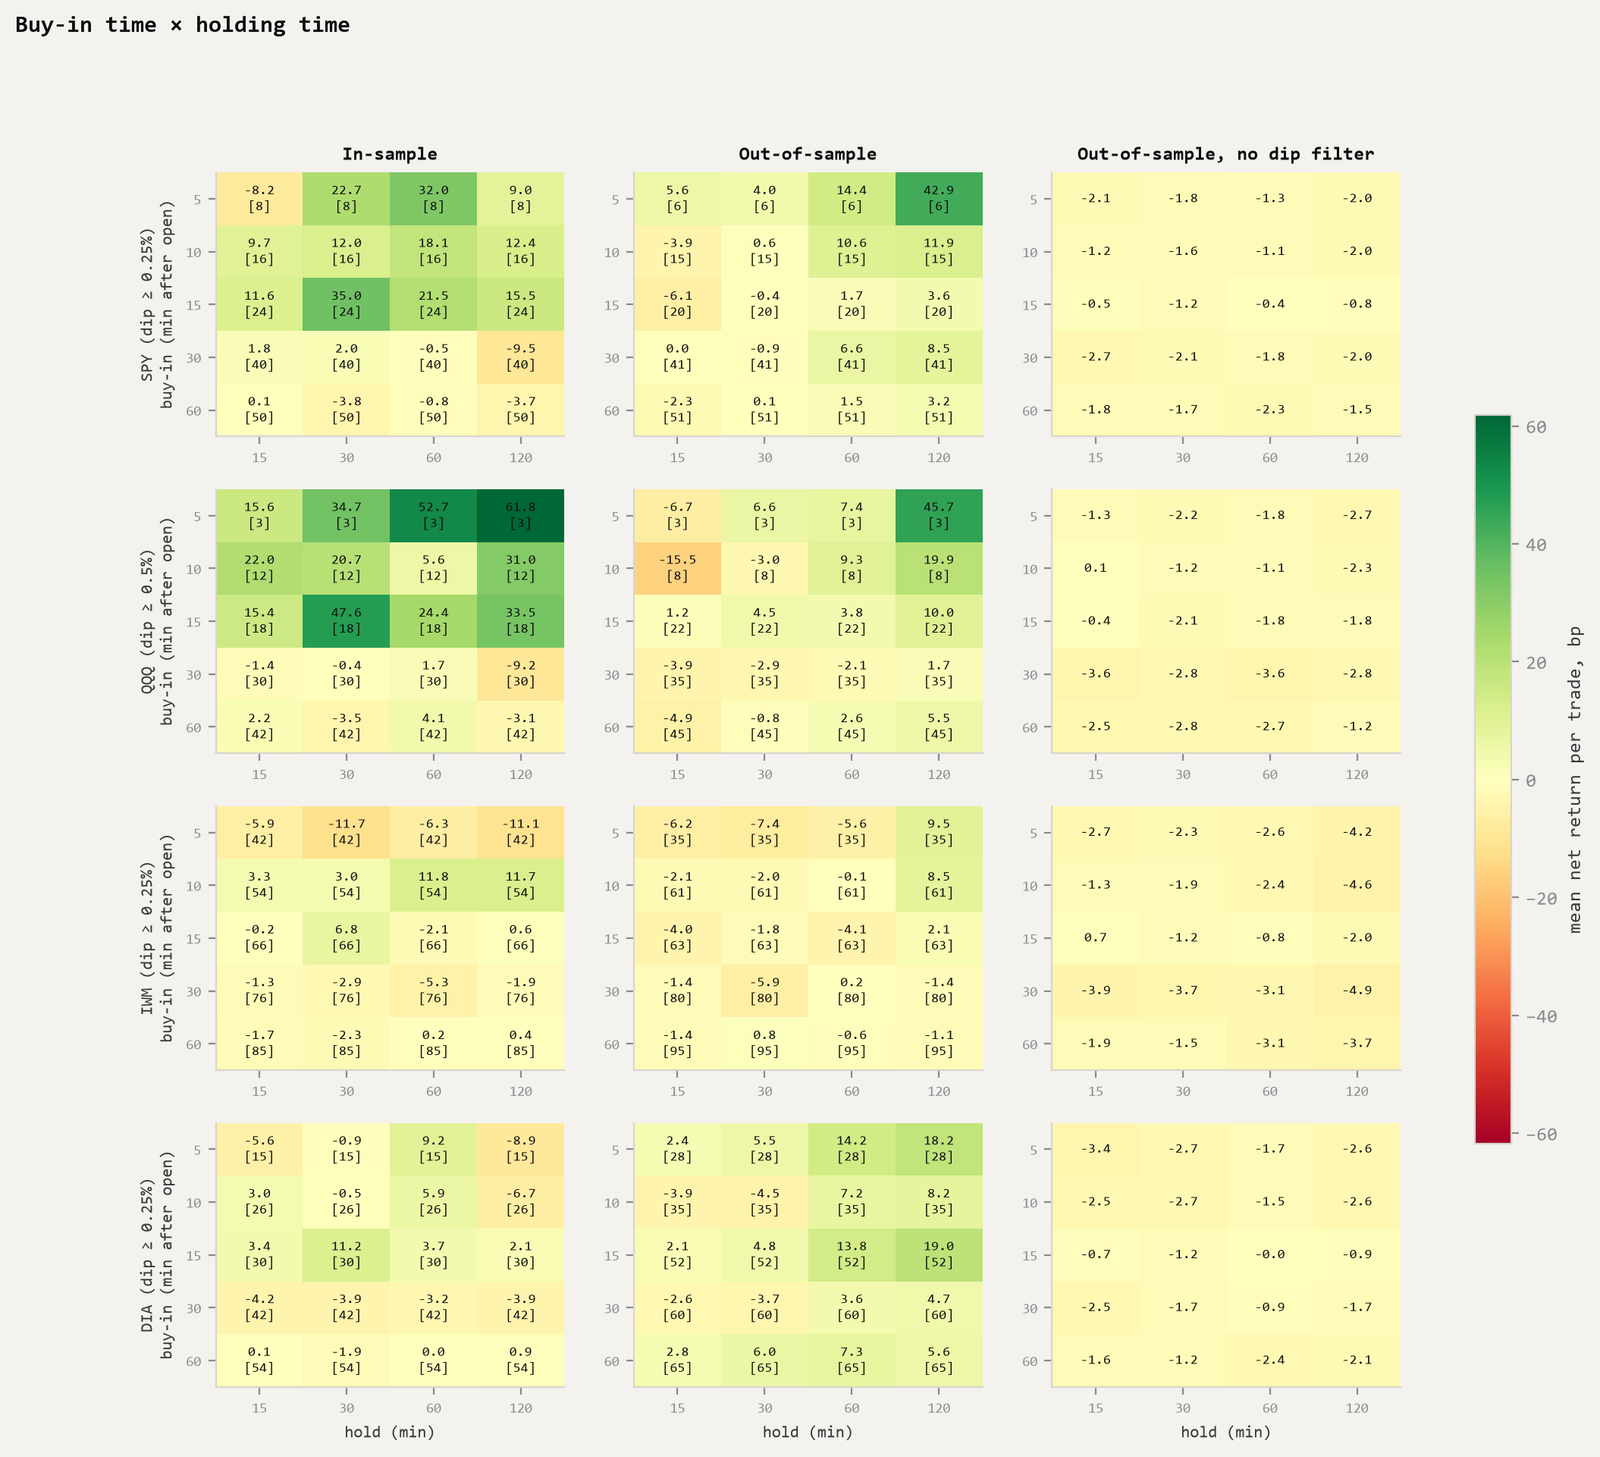
Two patterns are worth noting. The no-filter baseline (right column) sits between −4.9 and +0.7 bp, almost all of it slightly negative, so there is no time-of-day effect to ride on its own. And out-of-sample, longer holds of 60–120 minutes after a dip were more often positive than short ones, most clearly for DIA (positive at every buy-in time for 60- and 120-minute holds) and SPY. That pattern was not present in the in-sample year, which is why the selection didn't choose it. Choosing it now, after seeing the out-of-sample year, would be exactly the hindsight the design exists to prevent [15]. It is recorded as a hypothesis for future data instead (Section 7).
5.2 Costs
Table 4. Out-of-sample mean return per trade (bp) at different round-trip costs, selected settings.
| ETF | 0 bp | 2 bp (base) | 5 bp | 10 bp |
|---|---|---|---|---|
| SPY | 2.0 | 0.0 | −3.0 | −8.0 |
| QQQ | 4.6 | 2.6 | −0.4 | −5.4 |
| IWM | 1.9 | −0.1 | −3.1 | −8.1 |
| DIA | 6.8 | 4.8 | 1.8 | −3.2 |
Before any costs at all, the selected rules made 2–7 bp per trade. At 5 bp, three of four lose money; at 10 bp, all four do.
5.3 Stability over time
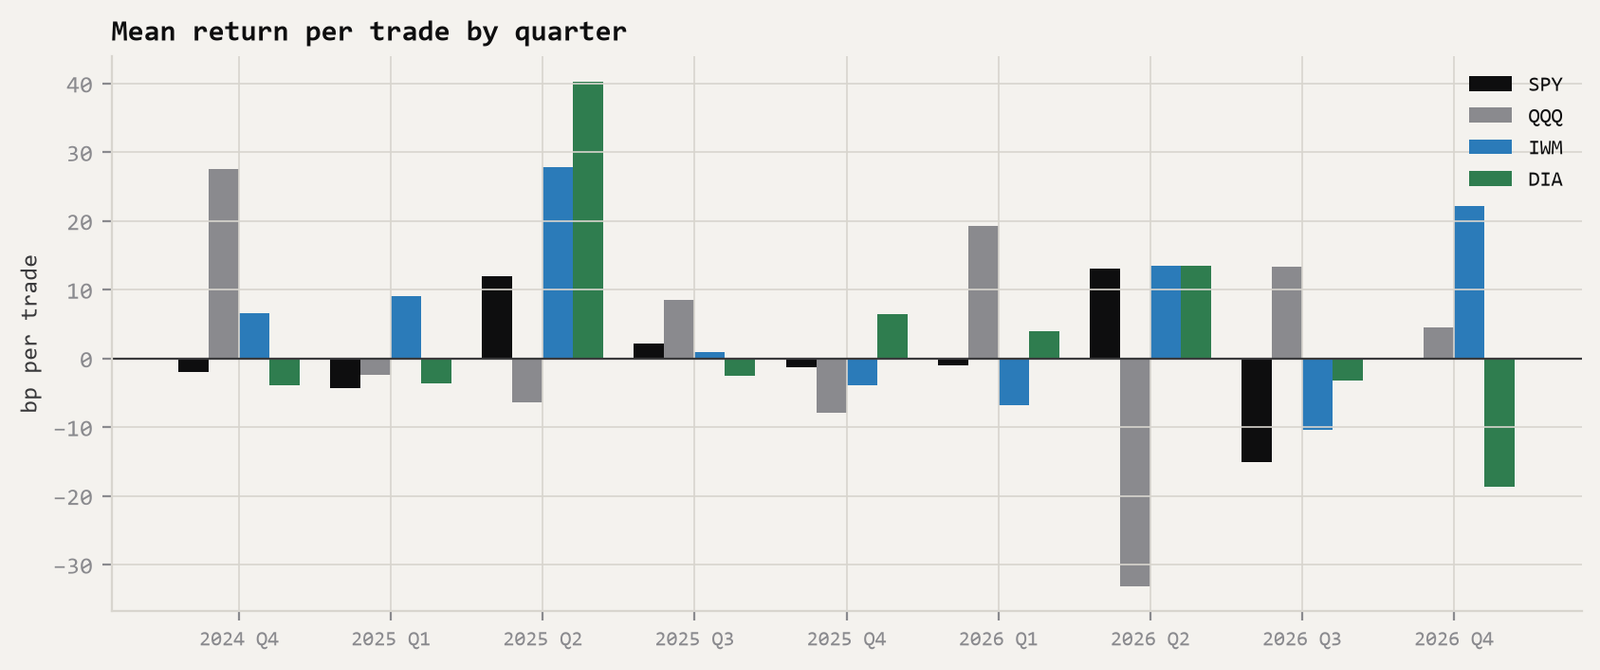
No ETF is positive in every quarter. Each quarter has at most about 20 trades per ETF (and only 0–3 in the partial final quarter), so single quarters are noisy, but the absence of any consistent sign is itself evidence against a stable effect.
5.4 Across the whole grid
Out-of-sample, 34% of the 400 combinations had a positive mean, and 18 of the 208 combinations with enough trades to test were significant at the 0.05 level. About 10 would be expected by chance; neighbouring combinations share most of their trades, so these are not independent results, and 18 is weak evidence at most.
6. Do the Results Include Real Trading Costs?
Short answer: partly. Every trade is charged a flat 2 bp round trip, meant to cover the bid-ask spread, exchange fees and slippage together. Exchange maker-taker fees and broker charges are not modelled one by one. Whether 2 bp is realistic depends mainly on who is trading and through which broker.
Table 5. The size of each cost component for these ETFs, in basis points, using each fund's median price in this data.
| Component | SPY | QQQ | IWM | DIA | In the 2 bp? |
|---|---|---|---|---|---|
| Median price | $662 | $597 | $243 | $463 | — |
| One-cent spread, crossed once [7] | 0.15 | 0.17 | 0.41 | 0.22 | Yes |
| Exchange "take" fee per side, at the $0.003/share cap [21] | 0.05 | 0.05 | 0.12 | 0.06 | Yes |
| Slippage beyond the quoted spread | Not measured; small for small orders | Partly | |||
| Broker commission, currency conversion, account fees | Broker-specific; can exceed the whole edge (below) | No | |||
Where the spread comes from. The spread is the gap between the best price buyers are bidding and the best price sellers are asking [6]; buying and selling immediately crosses it. For shares priced over $1, US rules have required displayed quotes in one-cent steps, so the quoted spread can't be narrower than one cent [7]. Table 5 uses that one-cent minimum, which for these prices is 0.15–0.41 bp. The rule applies to quotes, not to trades: trades can execute at prices between the bid and the ask, and in 2024 the SEC chose not to restrict trade prices to whole cents, partly because investors receive sub-penny "price improvement" [32]. So a small order can cost less than a full spread. Equally, real spreads can be wider than the minimum, particularly around the open: Ozenbas, Schwartz and Wood attribute part of the extra volatility in the opening half-hour to wider spreads and price discovery [10]. The data used here are trade prices, not quotes, so the actual spread at each entry and exit is unknown in either direction. The SEC also adopted a half-cent quoting minimum for the most tightly traded stocks in 2024, but its start has been postponed [21][22], so the one-cent minimum applied throughout this sample.
Maker-taker fees. Many US exchanges charge the side that takes liquidity (an order that trades immediately, as this rule's market orders do) and pay a rebate to the side that makes it (a limit order waiting on the book). Regulation NMS caps that access fee at $0.003 per share for shares priced at $1 or more. The SEC voted in 2024 to cut the cap to $0.001 [21], but compliance has been postponed, most recently to November 2027 [22], so $0.003 is the right upper bound for this sample. Even at that cap the fee is 0.05–0.12 bp per side here (Table 5). The rule is modelled as a taker on both entry and exit. Using limit orders instead could earn the rebate and avoid crossing the spread, but risks not being filled, which was not tested.
Brokers. This is the largest and most variable cost, and it isn't in the model. It matters less here than it would for a profitable rule, because no edge was found even before broker costs, but it decides whether any small edge found in future could be traded. Some US brokers charge no commission and are paid instead by the market makers that execute their customers' orders, known as payment for order flow [23][24]. UK investors face other costs. Buying US-dollar assets from a pound account usually involves a currency conversion fee: Trading 212, for example, charges 0.15% on each conversion [25], which is 15 bp on the purchase and another 15 bp on the sale, about fifteen times the 2 bp assumed here, unless the account holds US dollars. Contracts for difference (CFDs) and spread bets are another way to trade these prices from the UK; they are leveraged derivatives priced by the provider rather than the exchange, and the FCA restricts their sale to retail clients and requires providers to disclose what share of their retail accounts lose money [26].
Can UK investors buy these ETFs at all? Often not directly. EU and UK rules (PRIIPs) have required a key information document for investment products sold to retail clients, and US-domiciled ETFs such as SPY generally don't produce one, so many UK brokers don't offer them to retail customers [27][28]. The UK is replacing these rules with a new Consumer Composite Investments regime, which began on 6 April 2026 and applies fully from 8 June 2027 [29]; whether that changes access to US-domiciled ETFs is not yet clear. The usual alternative is a UCITS fund listed in London that tracks the same index, such as iShares Core S&P 500 UCITS ETF [31]. That is a different fund on a different exchange, so these results don't automatically carry over to it.
Conclusion on costs. The 2 bp assumption covers the exchange-level costs of a small order in these funds: one spread, at its one-cent minimum, plus maker-taker access fees at their cap total roughly 0.25–0.65 bp per round trip (Table 5), leaving some room for slippage. It does not include broker commissions, currency conversion or account fees. The results turn negative at 5–10 bp (Table 4), and a single currency conversion fee of 0.15% each way [25] is far larger than that, so a UK retail trader converting pounds for each trade would almost certainly have lost money following this rule, even in its best version.
7. The Potential Edge
Nothing here qualifies as an edge. Two observations are worth testing again on fresh data, as new hypotheses:
- DIA. The best performer: +4.8 bp per trade after 2 bp costs, still positive at 5 bp (+1.8 bp, Table 4), and ahead of 95.3% of time-matched random traders (Table 2). Against it: that last figure is not significant once four ETFs are accounted for (adjusted p = 0.19); its t-test is not significant (p = 0.11); its settings looked like noise in-sample (t = 0.64, Table 1); and its quarterly results swing between +40 and −19 bp (Figure 8).
- Longer holds after a dip. Out-of-sample, holding 60–120 minutes after a dip was more often profitable than holding 15–30 (Figure 7), especially for DIA and SPY. This was seen only after the out-of-sample year was revealed, so it can't be claimed from this data [15].
The honest way to test either lead is with data nobody has looked at: the months after October 2026 as they arrive, or, with a paid data plan [18], the years before October 2024, which would also allow the crisis-period comparisons in the original design. Both will be written down as new hypotheses before any such data is examined.
8. Discussion and Limitations
- Low statistical power. Two years, about 40–60 trades per ETF per year (Table 1). The test could only reliably detect edges of about 9–20 bp per trade (Section 4), larger than the returns found before costs (2–7 bp, Table 4). A null result here is weak evidence that no edge exists, not proof.
- One market environment. Prices mostly rose over the sample (SPY +31.8%, Section 2), with one sharp episode in April 2025 [20]. The rising market itself barely affects these trades, because almost all of the rise happened overnight: the average move during trading hours was under 0.15 bp per half-hour, tiny next to the effects being measured. What could matter is the type of market: a crash or a long bear market might produce dips that behave differently. Those periods need longer history to test.
- Execution model. Fills at the bar's opening trade price, with no market impact, delay or partial fills. That is optimistic for large orders and roughly fair for small ones.
- Trade bars, not quotes. The spread is assumed at its one-cent quoting minimum [7], not measured; real costs could be lower (price improvement [32]) or higher (wider spreads at the open [10]).
- Data snooping. Reduced by writing the design down first, the in-sample/out-of-sample split, Holm correction [14] and the random-trader test [16], but not eliminated: four ETFs, a 400-cell grid, a development run on overlapping data, and one comparison (the time-matched random traders) added after results were seen. That addition made the results weaker, not stronger.
- The four ETFs are not independent. They hold many of the same companies [3] and often dip on the same days, so four results are less evidence than four separate markets would be.
- Same-day only. Overnight holds, short-selling rallies and limit-order entry were not tested.
9. Conclusion
Buying early-session dips in the four largest US index ETFs did not produce a reliable profit from October 2024 to October 2026. The null hypothesis that dip trades earn nothing could not be rejected for any ETF, in-sample or out-of-sample (Table 1). Against 10,000 random traders who buy at the same time of day, the dip rule usually did somewhat better than buying without a dip, but not significantly so for any ETF once the four tests are taken together (Table 2). By the criteria written down before testing, the idea is dropped for all four ETFs (Table 3), and every version became unprofitable at a cost of 10 bp per round trip (Table 4). The test could only have detected edges of roughly 9–20 bp per trade, so it rules out a large edge, not a small one.
On costs: the modelled 2 bp covers exchange-level costs, namely the spread at its one-cent quoting minimum [7] and maker-taker access fees at their $0.003 cap [21], which together come to under 1 bp here (Table 5). It does not include broker commissions or currency conversion; a single 0.15% (15 bp) conversion fee [25] would on its own be more than twice the largest average return per trade before costs found here (6.8 bp, DIA, Table 4). For UK retail investors there is also an access problem: many brokers can't sell them these US-domiciled ETFs [27][28].
Two follow-ups are worth running on unseen data: whether DIA's result holds up, and whether holding for 60–120 minutes after a dip does better than short holds.
References
Web sources accessed 15 October 2026.
- U.S. Securities and Exchange Commission. Basis points. Investor.gov glossary. investor.gov
- U.S. Securities and Exchange Commission. Exchange-traded fund (ETF). Investor.gov glossary. investor.gov
- Fund issuers' product pages: State Street, SPDR S&P 500 ETF Trust (SPY); Invesco, Invesco QQQ Trust (QQQ); BlackRock, iShares Russell 2000 ETF (IWM); State Street, SPDR Dow Jones Industrial Average ETF Trust (DIA).
- New York Stock Exchange. Holidays & trading hours. nyse.com
- New York Stock Exchange. NYSE opening and closing auctions fact sheet. nyse.com (PDF)
- U.S. Securities and Exchange Commission. Bid-ask spread. Investor.gov glossary. investor.gov
- U.S. Securities and Exchange Commission. Responses to frequently asked questions concerning Rule 612 (minimum pricing increment) of Regulation NMS. sec.gov
- Wasserstein, R. L., & Lazar, N. A. (2016). The ASA statement on p-values: Context, process, and purpose. The American Statistician, 70(2), 129–133. doi:10.1080/00031305.2016.1154108
- Wood, R. A., McInish, T. H., & Ord, J. K. (1985). An investigation of transactions data for NYSE stocks. The Journal of Finance, 40(3), 723–739.
- Ozenbas, D., Schwartz, R. A., & Wood, R. A. (2002). Volatility in US and European equity markets: An assessment of market quality. International Finance, 5(3), 437–461. RePEc
- Grossman, S. J., & Miller, M. H. (1988). Liquidity and market structure. The Journal of Finance, 43(3), 617–637. NBER working paper 2641
- Gao, L., Han, Y., Li, S. Z., & Zhou, G. (2018). Market intraday momentum. Journal of Financial Economics, 129(2), 394–414.
- Heston, S. L., Korajczyk, R. A., & Sadka, R. (2010). Intraday patterns in the cross-section of stock returns. The Journal of Finance, 65(4), 1369–1407.
- Holm, S. (1979). A simple sequentially rejective multiple test procedure. Scandinavian Journal of Statistics, 6(2), 65–70.
- Harvey, C. R., Liu, Y., & Zhu, H. (2016). … and the cross-section of expected returns. The Review of Financial Studies, 29(1), 5–68.
- White, H. (2000). A reality check for data snooping. Econometrica, 68(5), 1097–1126.
- Massive (formerly Polygon.io). Pricing: Stocks Basic plan (5 API calls per minute, 2 years of historical data, minute aggregates), and 1-minute aggregate bars for SPY, QQQ, IWM and DIA. massive.com
- Alpha Vantage. API documentation: TIME_SERIES_INTRADAY. alphavantage.co. Free-key requests on 15 October 2026 returned "This is a premium endpoint."
- U.S. Securities and Exchange Commission. Ex-dividend dates: When are you entitled to stock and cash dividends. Investor.gov. investor.gov
- Associated Press (2025, 9 April). Stocks soar 9.5% to one of their biggest gains since WWII after Trump pauses most tariffs. Via American Press.
- U.S. Securities and Exchange Commission (2024). Fact sheet: Regulation NMS: Minimum pricing increments, access fees, and transparency of better priced orders (Release 34-101070). sec.gov (PDF)
- The Trade Informer (2026). SEC extends NMS relief to November 2027, proposes scrapping trade-through rule. tradeinformer.com
- U.S. Securities and Exchange Commission. Payment for order flow. Investor.gov glossary. investor.gov
- Morningstar. What is payment for order flow? morningstar.com
- Wise. Trading 212 fees (FX conversion fee of 0.15% on share purchases and sales in another currency). wise.com. Secondary source; check the broker's current fee schedule.
- Financial Conduct Authority (2019). PS19/18: Restricting contract for difference products sold to retail clients. fca.org.uk
- justETF. US-domiciled ETFs: Why they are no longer available from many online brokers. justetf.com
- Interactive Brokers. PRIIPs regulation (knowledge base). interactivebrokers.com
- Financial Conduct Authority (2025). PS25/20: Supporting informed decision making: Final rules for Consumer Composite Investments. fca.org.uk
- Yahoo Finance. SPY historical daily prices. finance.yahoo.com
- BlackRock. iShares Core S&P 500 UCITS ETF (CSPX). ishares.com
- Sidley Austin LLP (2024, October). SEC adopts rules modifying minimum pricing increments, access fee caps and order transparency. sidley.com
Appendix A. Reproducibility
| Code | Available on request (quant-lab, code fingerprint 0a408d6a470bc0df; run 20261015-194847_rp001_open_dip) |
|---|---|
| Environment | Python 3.13.3; numpy 2.5.4, pandas 3.0.6, scipy 1.18.1, matplotlib 3.11.2, mplfinance 0.12.10b0, pyarrow 26.0.0 |
| Random seeds | Random traders: seed 3 (same entry time, random days), seed 1 (random day & time), seed 2 (same days); trade-variability estimates: seeds 4–5; Figure 2 illustration: seed 7 |
| Data snapshots |
SPY massive-SPY-1min-20261015T173255 (428,165 bars, SHA-256 fcf7c644dc38a4ce…) QQQ massive-QQQ-1min-20261015T173723 (445,981 bars, cf43c029182a06cb…) IWM massive-IWM-1min-20261015T175320 (378,693 bars, b77192c394eb0b4e…) DIA massive-DIA-1min-20261015T175719 (254,024 bars, 14ef27053fb1e5e3…) Validation (daily, Yahoo): yahoo-SPY-1d-20261015T152247, yahoo-QQQ-1d-20261015T194807, yahoo-IWM-1d-20261015T194808, yahoo-DIA-1d-20261015T194810 |
| Raw data | Not redistributed (provider terms). Download the same range from Massive's aggregates endpoint, split-adjusted [17]. |
Appendix B. Revision History
| v1.0 — 15 October 2026 | Published. |
|---|---|
| v0.3 — 15 October 2026 | After review: added the time-matched random-trader comparison (disclosed as added after results) and adjustment for testing four ETFs; added statistical power; added the verdict against the pre-registered criteria; validated all four ETFs' data; corrected the market-drift limitation; added that trades can execute inside the quoted spread. |
| v0.2 — 15 October 2026 | Added a plain-English primer (1.1), sources for every factual statement, the market backdrop, and corrected the exchange-fee and UK-access sections. |
| v0.1 — 15 October 2026 | First draft for review. |
Educational research only, not financial advice. Results are historical simulations and do not predict future returns. Corrections are welcome at contact@yijie.space.