Educational research only, not financial advice. Sources were checked on 16 October 2026.
1. Introduction
1.1 The basics, in plain English
This section explains every term the paper relies on. Readers who trade can skip to 1.2. Terms shared with RP-001 [22] are repeated briefly so this paper stands on its own.
| The US trading day | The main US exchanges trade from 09:30 to 16:00 New York time on weekdays, apart from holidays and a few shortened days [4]. |
|---|---|
| ETF | An exchange-traded fund: a basket of shares traded on an exchange like a single share [2]. SPY tracks the S&P 500, QQQ the Nasdaq-100, IWM the Russell 2000 and DIA the Dow Jones Industrial Average [3]. |
| Basis point (bp) | One hundredth of one percent: 1 bp = 0.01% [1]. On a £1,000 trade, 1 bp is 10p. Returns here are in basis points per trade or per day. |
| Candlestick (5-minute bar) | Each candle covers five minutes and shows the open, close, high and low. Green means it closed higher than it opened; red, lower. |
| Indicator | A formula applied to past prices that produces a line or a signal on a chart. It only uses prices that have already happened. |
| Trend-following | Buying what has been rising and selling what has been falling, on the idea that moves tend to continue. Over long horizons and many markets, trend-following has a long research record [15]; whether it works over minutes and hours is a separate question. |
| True range and ATR | True range is how far the price moved in one bar, counting any jump from the previous bar's close. The average true range (ATR) is a smoothed average of it, introduced by J. Welles Wilder in 1978 [12]. It measures how much the price typically moves, not which way. |
| Supertrend | A trend-following indicator created by Olivier Seban [9][10] and introduced in the early 2000s [11], that draws a line a set number of ATRs away from the price [9]. In an uptrend the line sits below the price and only moves up; if the price closes below it, the trend flips to down and the line jumps above the price. The default settings are a 10-bar ATR and a multiplier of 3 [10][11]. |
| VWAP | Volume-weighted average price: the average price paid for every share traded so far that day, weighting each trade by its size. It is widely used as a benchmark for what a typical trader paid [13]. |
| Moving average (EMA) | An exponential moving average smooths recent prices, giving more weight to the newest [14]. Here it covers about one trading day (78 five-minute bars). |
| Long only | The rule only buys and later sells. It never bets on prices falling (no short selling). |
| Stop-loss and take-profit | A stop-loss sells automatically if the price falls a set distance below the purchase price. A take-profit sells automatically once the price has risen a set distance. Here both are set in ATRs, so they adapt to how volatile the market is. |
| Bid, ask, spread, costs | The best buying price (bid) and selling price (ask) differ by the spread [5], which is one of the costs of trading, along with exchange fees and broker charges. Costs are deducted from every trade, in basis points. |
| p-value | Roughly how often a result at least this good would appear by chance if the rule really had no edge. Below 0.05 is a common, imperfect threshold for "significant"; it is not the probability that the idea is true [8]. |
| Multiple testing | Testing many strategies at once means some will look good by luck. Corrections such as Holm's method [17] raise the bar to account for that, a problem that is widespread in finance research [18]. |
| Random traders | Simulated traders who make the same number of trades at the same times of day and hold for similar lengths, but on random days, ignoring the indicator. Comparing against 10,000 of them asks: does the signal add anything? |
1.2 The question
Supertrend is built into common charting platforms [9][11] and, according to cTrader, gained popularity among traders after its introduction [11]. Natural additions to a rule like this include tighter stops, profit targets, waiting out the volatile open, or only buying when the price is above its VWAP or a moving average. Each sounds sensible; the question is whether it survives costs, an advance plan, and a correction for trying many ideas at once.
This paper tests exactly that. It takes one standard Supertrend rule, adds seven tweaks one at a time, and asks a narrow question: does any tweak make it reliably better, after costs, than the plain rule and than random timing? The original idea for this paper was to confirm signals with order flow (who is buying versus selling); that data isn't available free for US ETFs [22], so the two filters use price and volume instead, through VWAP and a moving average.
Formally:
The full design, including every rule, test and abandonment criterion, was written down and approved on 15 October 2026, before any code was run. No changes were made after results. The data is the same as RP-001's [22], which the author had already studied, but no Supertrend rule had been run on it before.
2. Data
| Source | Massive (formerly Polygon.io), free Stocks Basic plan, 1-minute bars [21]: the same pinned snapshots as RP-001 [22] |
|---|---|
| Instruments | SPY, QQQ, IWM, DIA [3] |
| Period | 21 October 2024 to 14 October 2026: 492 regular trading days per ETF (5 shortened days removed) |
| Bars | 5-minute bars built from the 1-minute bars (78 per day, 09:30–16:00 [4]). Stops and targets are checked on the 1-minute bars. A minute with no trades is filled with the previous price. Compared with a standard resampling of the raw data, every 5-minute bar is identical for SPY, QQQ and IWM; for DIA, 59 of 38,376 bars (0.15%) differ, all containing such untraded minutes, by a median of 1.8 bp. |
| Validation | In RP-001, all four ETFs' 09:30 opening prices matched Yahoo Finance's daily opens [23] within 0.25 bp on every day [22]. |
| Years | Results are also reported separately for the first year (to 30 September 2025) and the second (from 1 October 2025). No settings were chosen from either. |
3. Methodology
3.1 Supertrend
For 5-minute bar t with high \( H_t \), low \( L_t \) and close \( C_t \), the true range and Wilder's ATR over \( n = 10 \) bars are [12]
The basic bands are set \( m = 3 \) ATRs either side of the bar's midpoint, \( \tfrac{H_t + L_t}{2} \pm m \cdot ATR_t \). The lower band may only rise while the price stays above it, and the upper band may only fall while the price stays below it. The trend turns up when a bar closes above the previous upper band and down when it closes below the previous lower band [9]. This follows the widely used TradingView form; TA-Lib notes that an earlier published version differs slightly at the flips [10]. The indicator runs continuously across days, so the overnight gap counts in the first bar's true range.
The implementation was checked against a separately written version: ATR agreed to within \( 10^{-14} \) and the trend direction matched on all 38,376 five-minute bars of SPY.
3.2 The rules
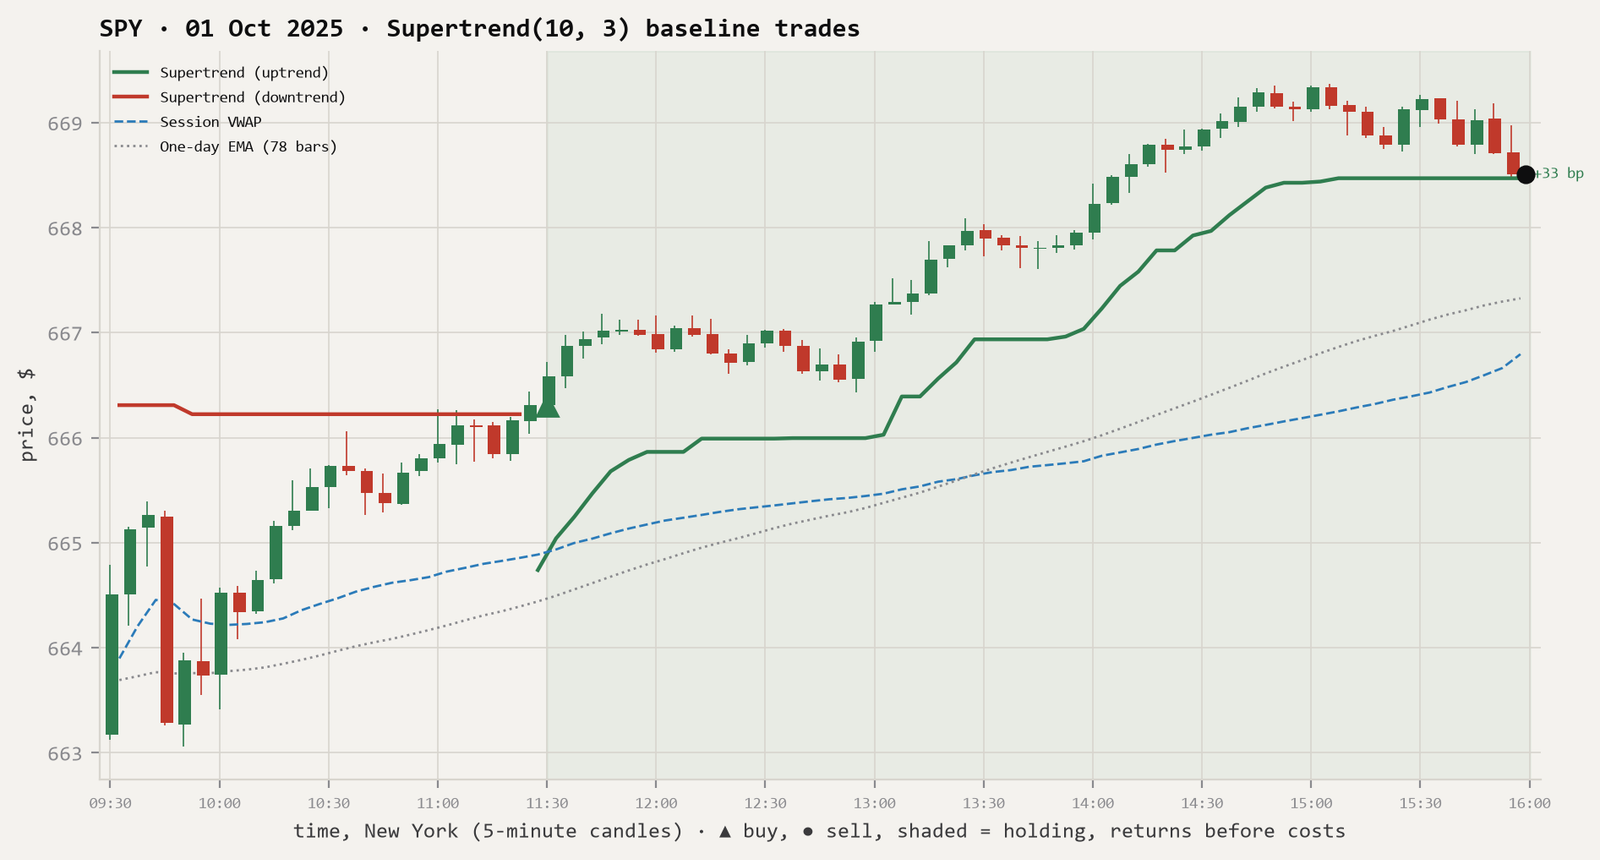
Baseline (B). Buy at the open of the next 5-minute bar after the trend turns up; sell at the open of the next bar after it turns down. Long only. No new trades after 15:30, and any open position is sold at the 16:00 close, so nothing is held overnight. A trade only starts on a flip, not because the trend is already up at 09:30.
Variants. Each changes exactly one thing:
Table 1. The eight rules, fixed before any code ran.
| ID | Group | Change from the baseline |
|---|---|---|
| B | — | Baseline: Supertrend (10, 3) on 5-minute bars, as above |
| T1 | Timing | Every buy and sell happens one bar (5 minutes) later |
| T2 | Timing | Ignore buy signals before 10:00 (skip the opening half-hour) |
| X1 | Exits | Add a stop-loss 1.5 ATR below the purchase price |
| X2 | Exits | Stop-loss 1.5 ATR, plus take-profit 2 ATR above |
| X3 | Exits | Stop-loss 1.5 ATR, plus take-profit 3 ATR above |
| F1 | Filter | Only buy if the signal bar closed above the session VWAP |
| F2 | Filter | Only buy if the signal bar closed above its one-day (78-bar) EMA |
Session VWAP at bar k is \( \sum p_i v_i / \sum v_i \) over every minute from 09:30, using each minute's volume-weighted price \( p_i \) and volume \( v_i \) [13]. The EMA is \( E_t = \alpha C_t + (1-\alpha) E_{t-1} \) with \( \alpha = 2/79 \) [14]. Stops and targets use the 5-minute ATR at the signal bar and are checked minute by minute. They fill at their level, or at the minute's opening price if the price jumps through. If both are touched in the same minute, the stop is assumed to fill first, the cautious choice (in practice this never happened; Section 4.2).
That is 8 rules × 4 ETFs = 32 strategies. There was no search over settings: every strategy is reported. The rules were checked against the raw 1-minute data on the example day; for instance, X2's take-profit at 667.31 filled in the first minute the price reached it, 13:05.
3.3 Costs
Every round trip pays 2 bp, as in RP-001, with results also shown at 0, 5 and 10 bp. For these funds the exchange-level costs of a small order are smaller than that: a one-cent quoted spread [6] is 0.15–0.41 bp at their prices, and exchange access fees are capped at $0.003 per share [24], under 0.15 bp [22]. Trades can also fill inside the spread [7]. Broker charges are not included (Section 6).
3.4 Tests
- Is a strategy profitable? One-sided t-test on the mean net return per trade, and a Newey–West t-test [20] on daily returns, which allows for returns being correlated from day to day.
- Does a variant beat the baseline? Each day's variant return minus the baseline's, tested with Newey–West [20], then Holm-corrected [17] across all 28 variant × ETF comparisons.
- Does it beat random timing? For each strategy, 10,000 random traders make the same number of trades on randomly chosen days, with entry times drawn from the strategy's own entry times and holding times drawn from its own holds. Comparing against traders who enter at the same times of day matters, because RP-001 showed that random times spread across the whole day understate how much early-session trades vary [22]. The share beaten is converted to a p-value and multiplied by 32 (Bonferroni) for the number of strategies, in the spirit of White's reality check [16][19].
- Is it stable? The first and second years are reported separately.
- Power. The smallest effect each test had an 80% chance to detect is reported, so a null result can be read correctly.
Criteria for abandoning a variant (fixed in advance): it is dropped unless it (1) beats the baseline after Holm correction, (2) improves on the baseline in both years, (3) is still profitable at 5 bp of costs, and (4) beats 95% of time-matched random traders after the Bonferroni adjustment.
4. Results
4.1 The baseline
Table 2. Baseline Supertrend (10, 3), long only, full sample. Returns in basis points per trade after 2 bp costs unless stated.
| ETF | Trades | Per day | Mean | Win rate | Avg hold | p-value | Random beaten | Before costs | Year 1 | Year 2 |
|---|---|---|---|---|---|---|---|---|---|---|
| SPY | 446 | 0.91 | −1.4 | 43% | 156 min | 0.69 | 58% | +0.6 | −1.3 | −1.5 |
| QQQ | 433 | 0.88 | +2.2 | 46% | 164 min | 0.26 | 89% | +4.2 | +4.0 | +0.6 |
| IWM | 462 | 0.94 | +0.6 | 45% | 159 min | 0.43 | 85% | +2.6 | +1.3 | +0.0 |
| DIA | 487 | 0.99 | −0.8 | 40% | 145 min | 0.63 | 77% | +1.2 | +0.8 | −2.2 |
The baseline traded about once a day, held for two and a half hours on average, and won on 40–46% of trades. About 58% of trades ended on a down-flip and the rest at the 16:00 close. Before costs it made a little money on every ETF (+0.6 to +4.2 bp per trade); after 2 bp, two of four were negative, and none was close to significant (smallest p = 0.26, QQQ). Against time-matched random traders it beat 58–89%, short of 95%. QQQ's result also faded from +4.0 bp in the first year to +0.6 in the second.
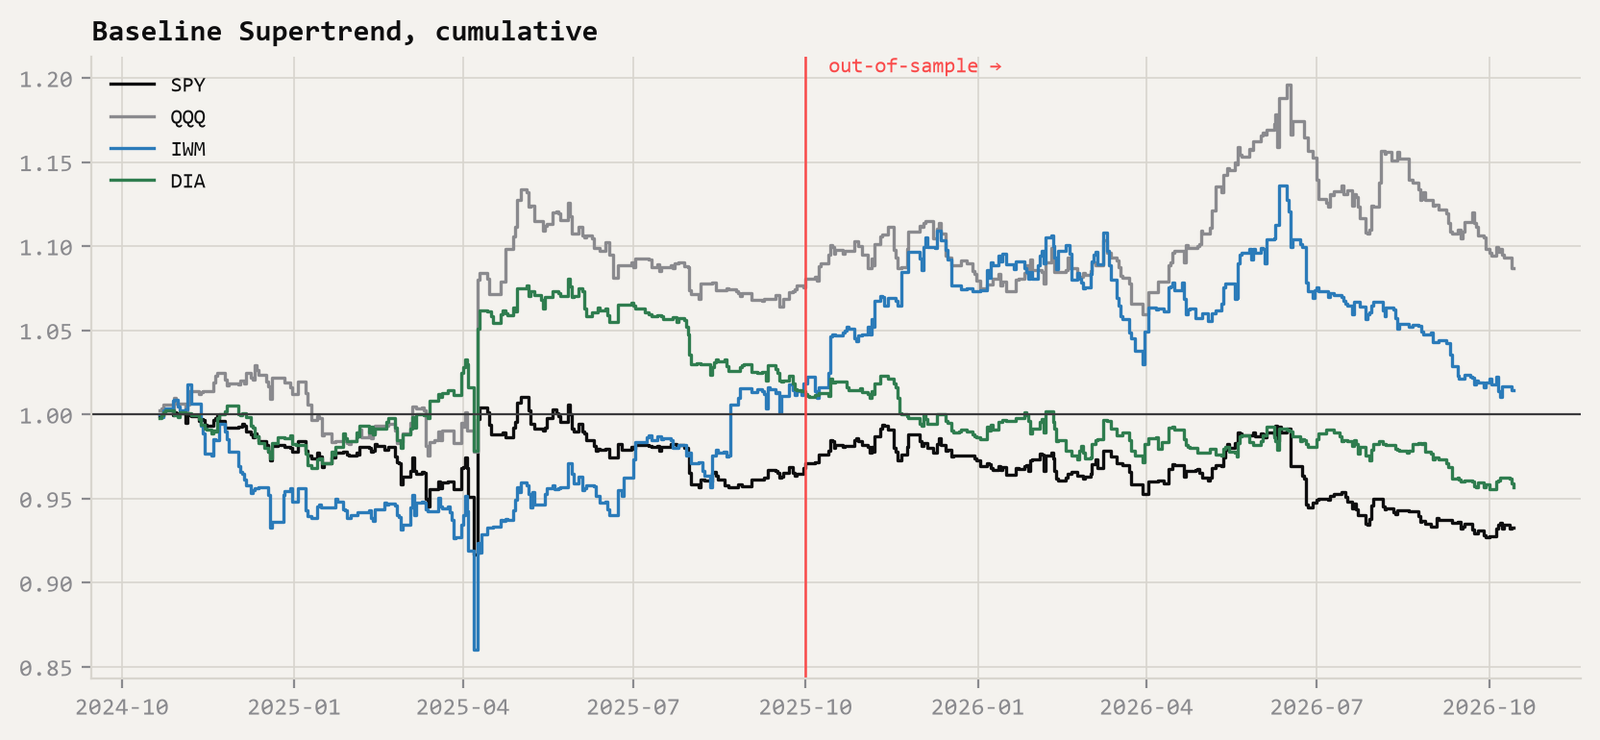
4.2 The tweaks
Table 3. Mean net return per trade (bp, after 2 bp costs) for every rule. Trade counts: B, T1, X1–X3 ≈ 430–490 per ETF; T2, F1, F2 ≈ 300–365.
| Rule | SPY | QQQ | IWM | DIA |
|---|---|---|---|---|
| B Baseline | −1.4 | +2.2 | +0.6 | −0.8 |
| T1 One bar later | −1.3 | +1.8 | +0.4 | −0.7 |
| T2 Skip first 30 min | −3.9 | −1.6 | −0.5 | −2.2 |
| X1 Stop 1.5 ATR | −5.3 | −1.0 | −1.0 | −2.5 |
| X2 Stop + target 2 ATR | −2.6 | +2.6 | −1.7 | −1.4 |
| X3 Stop + target 3 ATR | −4.2 | +0.7 | −2.5 | −2.6 |
| F1 Above VWAP | −1.9 | +2.0 | −0.3 | −0.2 |
| F2 Above one-day EMA | −5.2 | −1.2 | +1.3 | −2.5 |
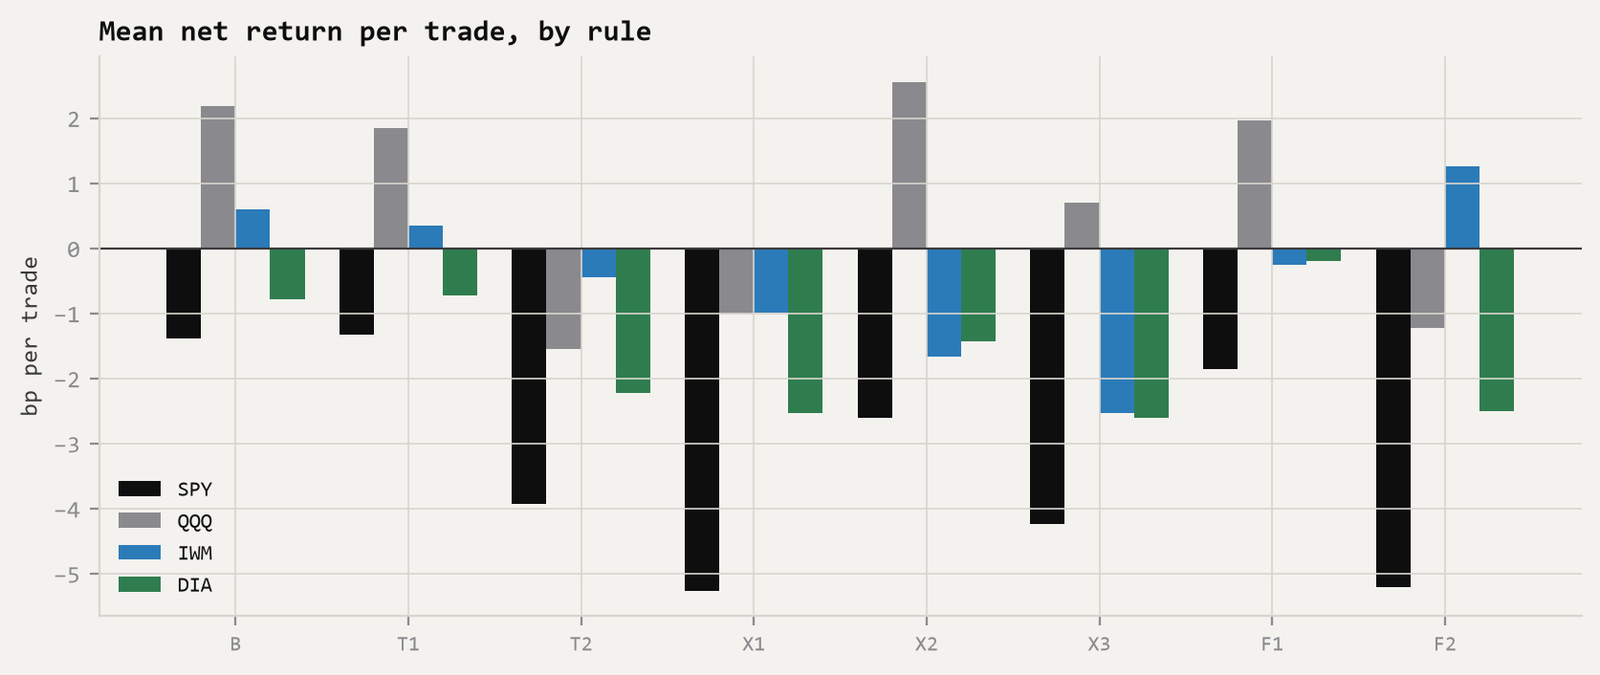
Compared with the baseline on the same days (Figure 4), 23 of the 28 variant–ETF combinations did worse. The five that did better improved by at most 0.6 bp per day, and none was significant: the smallest one-sided p was 0.18 (DIA, VWAP filter), and after Holm correction every p was 1.00.
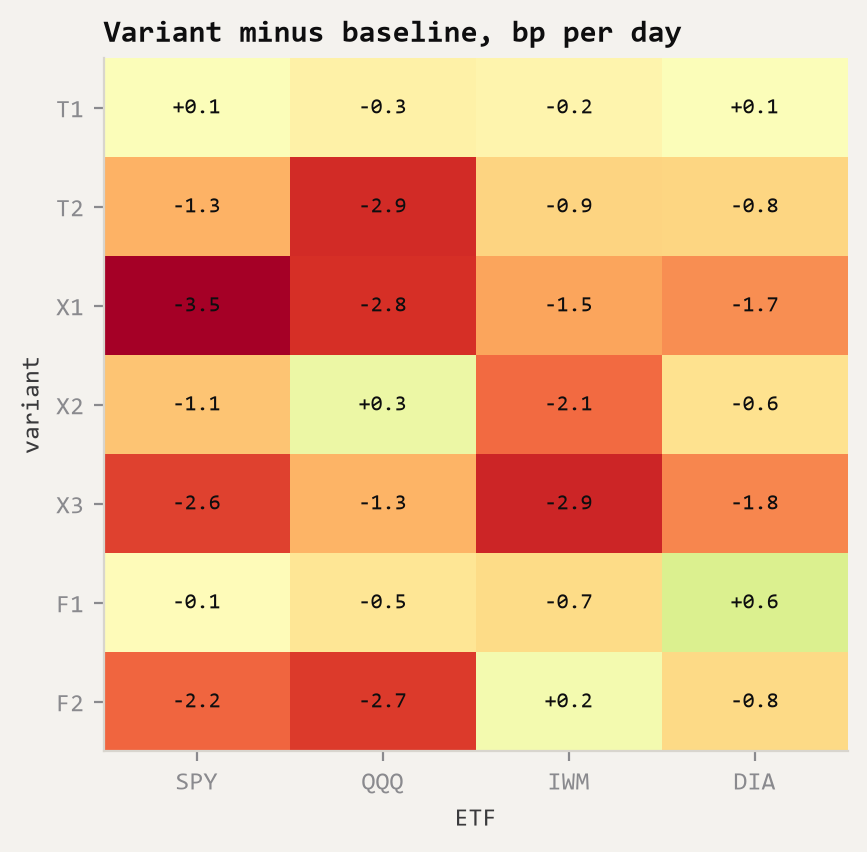
Stops hurt. Adding a 1.5-ATR stop (X1) made every ETF worse, by 1.5–3.5 bp per day. The stop was hit on 52–56% of trades, the win rate fell from 40–46% to 30–36%, and the average hold shrank from about 150 to about 105 minutes. Why stops hurt shows in what happened after them (Table 4): on average, the price then rose 2.9–7.0 bp before the time the baseline would have sold. The stops tended to sell near short-term lows, which then partly recovered. Most stopped trades were losers anyway (only 19–23% would have ended in profit under the baseline), but the stop locked in the loss at a worse point than simply waiting for the down-flip. That is the opposite of momentum. Kaminski and Lo show that stop-loss rules can add value only when returns have momentum [16], and at this horizon the price after a 1.5-ATR fall tended to bounce rather than continue. Adding a take-profit (X2, X3) did not rescue the stop: about half of trades still ended at the stop and only 23–44% at the target.
Table 4. What happened after X1's stops (descriptive, added after review). "Move after stop" is the price change from the stop exit to the time the baseline sold the same position.
| ETF | Trades stopped | Move after stop | Recovered above stop | Would have profited under B |
|---|---|---|---|---|
| SPY | 56% | +7.0 bp | 39% | 23% |
| QQQ | 52% | +6.2 bp | 33% | 21% |
| IWM | 55% | +2.9 bp | 37% | 20% |
| DIA | 54% | +3.3 bp | 36% | 19% |
Two checks on the stop and target model: the cautious "stop fills first" assumption for minutes touching both levels never applied, as no minute touched both in any ETF. Stops filled below their level because the price jumped through them on under 1% of stops for SPY, QQQ and IWM, and 6% for DIA.
Timing barely matters. Executing every trade five minutes later (T1) changed daily returns by at most 0.3 bp either way. With holds of about two and a half hours, a five-minute delay is small.
Skipping the open hurt. T2 was worse on all four ETFs, by 0.8–2.9 bp per day. T2 doesn't just wait until 10:00: if the trend turns up before 10:00, it skips that whole uptrend, because the rule only buys on a fresh flip. Those early-flip trades were the baseline's best by a wide margin, at +3.0 to +10.6 bp per trade with holds of over three hours, against −3.9 to −0.5 bp for all other baseline trades. This comparison was made after seeing the results, so it is an observation, not a finding: "Supertrend flips before 10:00" would need to be written down as a new hypothesis and tested on fresh data.
Filters. The VWAP filter (F1) removed about a fifth of trades and left results roughly unchanged (−0.7 to +0.6 bp per day). The one-day EMA filter (F2) removed about a third and was worse on three of four ETFs.
4.3 Against random traders
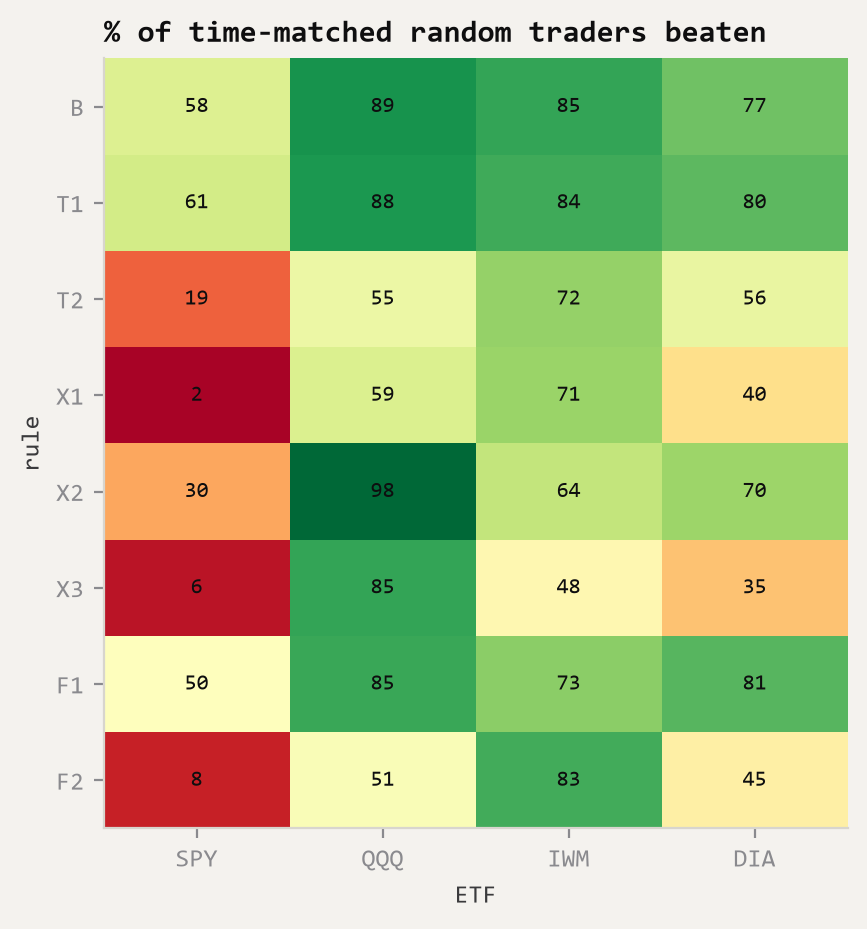
Most strategies beat between a fifth and nine-tenths of random traders. One cleared 95%: QQQ X2, at 98.4% (p = 0.016). With 32 strategies tested, about 1.6 would be expected to clear 95% by luck if they were independent; after the Bonferroni adjustment, QQQ X2's p-value is 0.52. Several strategies did markedly worse than random timing, such as SPY with a stop (X1), which beat only 2%. Its random traders held for the same spread of lengths but sold at a time, not at a stop. Selling at the stop was worse, consistent with the rebound after stops in Table 4.
4.4 Verdict against the pre-registered criteria
Table 5. Each variant against the four criteria fixed in advance: (1) beats the baseline after Holm correction; (2) better than the baseline in both years; (3) profitable at 5 bp; (4) beats 95% of time-matched random traders after Bonferroni. Number of criteria passed in brackets.
| Variant | SPY | QQQ | IWM | DIA |
|---|---|---|---|---|
| T1 One bar later | drop (1/4) | drop (0/4) | drop (0/4) | drop (1/4) |
| T2 Skip first 30 min | drop (0/4) | drop (0/4) | drop (0/4) | drop (0/4) |
| X1 Stop 1.5 ATR | drop (0/4) | drop (0/4) | drop (0/4) | drop (0/4) |
| X2 Stop + target 2 ATR | drop (0/4) | drop (1/4) | drop (0/4) | drop (0/4) |
| X3 Stop + target 3 ATR | drop (0/4) | drop (0/4) | drop (0/4) | drop (0/4) |
| F1 Above VWAP | drop (0/4) | drop (0/4) | drop (0/4) | drop (1/4) |
| F2 Above one-day EMA | drop (0/4) | drop (0/4) | drop (0/4) | drop (0/4) |
Every variant is dropped on every ETF. The only criterion any variant passed was (2), improving on the baseline in both years, which four did, each by under 1.2 bp per day. No variant passed (1), (3) or (4) anywhere: none beat the baseline significantly, none made money at 5 bp of costs, and none beat random traders once the 32 tests were accounted for.
5. Costs and Power
Table 6. Baseline mean return per trade (bp) at different round-trip costs.
| ETF | 0 bp | 2 bp (base) | 5 bp | 10 bp |
|---|---|---|---|---|
| SPY | +0.6 | −1.4 | −4.4 | −9.4 |
| QQQ | +4.2 | +2.2 | −0.8 | −5.8 |
| IWM | +2.6 | +0.6 | −2.4 | −7.4 |
| DIA | +1.2 | −0.8 | −3.8 | −8.8 |
At 5 bp, every one of the 32 strategies loses money. The best result before any costs at all is +4.6 bp per trade (QQQ, X2).
How big an effect could these tests detect? With 430–490 trades per ETF, the baseline test had an 80% chance of detecting a true edge of 5.7–8.6 bp per trade. The comparisons against the baseline were most sensitive for small changes (T1: 1.3–2.1 bp per day; F1: 1.7–2.8) and least for the exit variants (X1–X3: 4.9–7.2 bp per day), because changing exits changes many trades at once. So the study rules out large improvements, and for the timing and VWAP variants fairly small ones, but a modest gain from different exits could go undetected.
6. Trading Costs in Practice
The 2 bp per round trip covers exchange-level costs for a small order: the one-cent quoted spread [6] and exchange access fees at their $0.003-per-share cap [24], which together come to under 1 bp for these funds [22]. It does not include broker charges. These matter more here than in RP-001, because Supertrend trades about once a day per ETF. A UK investor converting pounds to dollars for each trade could, for example, pay a 0.15% currency conversion fee each way at one UK broker [25], 30 bp per round trip, far more than any return found here. Many UK brokers also don't offer US-domiciled ETFs such as SPY to retail customers at all, because those funds don't provide the key information document UK rules have required [26][27]. RP-001 discusses these costs in detail [22].
7. Discussion and Limitations
- One indicator setting. Only Supertrend (10, 3) on 5-minute bars was tested, deliberately, to avoid searching for lucky settings. Other bar lengths or multipliers might behave differently; testing them is a separate, pre-registered study.
- Two years, one kind of market. The window was mostly rising, with one sharp episode in April 2025 [22]. Trend-following's long-horizon record [15] comes from decades and many markets; two years of intraday data can't speak to that.
- Long only, intraday only. Short-selling the down-flips and holding overnight were not tested.
- Execution. Fills at the minute's opening trade price, or at the stop or target level, with no market impact or delay beyond what T1 adds. Stops in fast markets can fill worse than their level, which would make X1–X3 look worse still.
- Filters are not order flow. VWAP and the EMA use price and volume, not the buy-versus-sell information the original idea had in mind.
- Not independent. The four ETFs hold many of the same companies [3], and the variants share most trades with the baseline, so the 32 results are less evidence than 32 separate studies.
- Untraded minutes. A minute without trades takes the previous price, and an order "filled" in that minute uses it. This affects DIA most (99.7% minute coverage) and changes 0.15% of its 5-minute bars (Section 2).
- Post-hoc observations. Table 4 and the early-flip comparison in Section 4.2 were added after review to explain results. They describe what happened and are not tests; in particular, the strong early-flip trades are a lead for a new, pre-registered study, not a finding of this one.
- Same data as RP-001. The author had already studied this data, though not with Supertrend. The design was fixed before any Supertrend rule was run, and no amendments were made after results.
8. Conclusion
Plain Supertrend (10, 3) on 5-minute bars of SPY, QQQ, IWM and DIA roughly broke even after 2 bp of costs over October 2024 to October 2026, and was not significantly profitable on any of them (Table 2). None of the seven tweaks tested improved it reliably (Figure 4, Table 5). Adding a stop-loss made results worse on every ETF: after a stop, prices tended to recover, the opposite of the momentum that stops need in order to help [16]. Delaying execution by five minutes made almost no difference; skipping the opening half-hour hurt, because it missed the uptrends that started early, which were the baseline's best trades; and the VWAP and moving-average filters did not help. Every strategy lost money at 5 bp of costs (Table 6), and broker charges such as currency conversion would be far larger [25]. By the criteria fixed before testing, all 28 variant–ETF combinations are dropped.
The tests could detect improvements of roughly 1–7 bp per day, so small gains, especially from different exits, can't be ruled out. What the results do show is that the common tweaks, applied one at a time with standard settings, don't turn Supertrend into an intraday edge in these funds. One observation is worth a separate, pre-registered test on fresh data: the baseline's trades on uptrends that began before 10:00 did much better than the rest (Section 4.2).
References
Web sources accessed 16 October 2026.
- U.S. Securities and Exchange Commission. Basis points. Investor.gov glossary. investor.gov
- U.S. Securities and Exchange Commission. Exchange-traded fund (ETF). Investor.gov glossary. investor.gov
- Fund issuers' product pages: State Street, SPY; Invesco, QQQ; BlackRock, IWM; State Street, DIA.
- New York Stock Exchange. Holidays & trading hours. nyse.com
- U.S. Securities and Exchange Commission. Bid-ask spread. Investor.gov glossary. investor.gov
- U.S. Securities and Exchange Commission. Responses to frequently asked questions concerning Rule 612 (minimum pricing increment) of Regulation NMS. sec.gov
- Sidley Austin LLP (2024, October). SEC adopts rules modifying minimum pricing increments, access fee caps and order transparency. sidley.com
- Wasserstein, R. L., & Lazar, N. A. (2016). The ASA statement on p-values: Context, process, and purpose. The American Statistician, 70(2), 129–133. doi:10.1080/00031305.2016.1154108
- TradingView. Supertrend (support article: calculation, ATR length and multiplier). tradingview.com
- TA-Lib. SuperTrend (SUPERTREND): function reference, attribution to Olivier Seban and notes on variants. ta-lib.org
- cTrader. Supertrend (built-in indicator help). help.ctrader.com
- Wilder, J. W., Jr. (1978). New Concepts in Technical Trading Systems. Greensboro, NC: Trend Research. ISBN 978-0-89459-027-6.
- Berkowitz, S. A., Logue, D. E., & Noser, E. A., Jr. (1988). The total cost of transactions on the NYSE. The Journal of Finance, 43(1), 97–112.
- NIST/SEMATECH. e-Handbook of Statistical Methods, 6.4.3.1: Single exponential smoothing. itl.nist.gov
- Hurst, B., Ooi, Y. H., & Pedersen, L. H. (2017). A century of evidence on trend-following investing. The Journal of Portfolio Management, 44(1), 15–29. aqr.com
- Kaminski, K. M., & Lo, A. W. (2014). When do stop-loss rules stop losses? Journal of Financial Markets, 18, 234–254. MIT open access
- Holm, S. (1979). A simple sequentially rejective multiple test procedure. Scandinavian Journal of Statistics, 6(2), 65–70.
- Harvey, C. R., Liu, Y., & Zhu, H. (2016). … and the cross-section of expected returns. The Review of Financial Studies, 29(1), 5–68.
- White, H. (2000). A reality check for data snooping. Econometrica, 68(5), 1097–1126.
- Newey, W. K., & West, K. D. (1987). A simple, positive semi-definite, heteroskedasticity and autocorrelation consistent covariance matrix. Econometrica, 55(3), 703–708.
- Massive (formerly Polygon.io). Pricing: Stocks Basic plan, and 1-minute aggregate bars for SPY, QQQ, IWM and DIA. massive.com
- Liu, Y. J. (2026). Buying the Morning Dip: Do Early-Session Falls in US Index ETFs Reverse? (Research Paper RP-001, v1.0). yijie.space/research
- Yahoo Finance. Historical daily prices (used for data validation in RP-001). finance.yahoo.com
- U.S. Securities and Exchange Commission (2024). Fact sheet: Regulation NMS: Minimum pricing increments, access fees, and transparency of better priced orders (Release 34-101070). sec.gov (PDF)
- Wise. Trading 212 fees (FX conversion fee of 0.15%). wise.com. Secondary source; check the broker's current fee schedule.
- justETF. US-domiciled ETFs: Why they are no longer available from many online brokers. justetf.com
- Interactive Brokers. PRIIPs regulation (knowledge base). interactivebrokers.com
Appendix A. Reproducibility
| Code | Available on request (quant-lab, code fingerprint 1b0359a8a3991e0e; run 20261016-110412_rp002_supertrend). Re-running reproduced every number exactly. |
|---|---|
| Environment | Python 3.13.3; numpy 2.5.4, pandas 3.0.6, scipy 1.18.1, matplotlib 3.11.2, mplfinance 0.12.10b0, pyarrow 26.0.0 |
| Random seeds | Random traders: seed 1000 + 10 × (ETF index) + (rule index), ETFs ordered SPY, QQQ, IWM, DIA and rules as in Table 1 |
| Data snapshots |
SPY massive-SPY-1min-20261015T173255 · QQQ massive-QQQ-1min-20261015T173723 IWM massive-IWM-1min-20261015T175320 · DIA massive-DIA-1min-20261015T175719 (identical to RP-001; SHA-256 checksums in RP-001 Appendix A [22]) |
| Raw data | Not redistributed (provider terms). Download the same range from Massive [21]. |
Appendix B. Revision History
| v1.0 — 17 October 2026 | Published. |
|---|---|
| v0.2 — 16 October 2026 | After review: explained why stops hurt with data (prices rebounded after stops; Table 4) and corrected the stop-loss theory citation; explained what skipping the open removes; corrected Figure 2's caption (end values); corrected the 5-minute bar check for DIA; reworded unsupported claims in the introduction and the random-trader section; added post-hoc and untraded-minute limitations; replaced the example chart's entry–exit line with shading. Results unchanged. |
| v0.1 — 16 October 2026 | First draft for review. |
Educational research only, not financial advice. Results are historical simulations and do not predict future returns. Corrections are welcome at contact@yijie.space.